Performance Insights Across an Entire Company
Automations and alerting keep you up-to-date
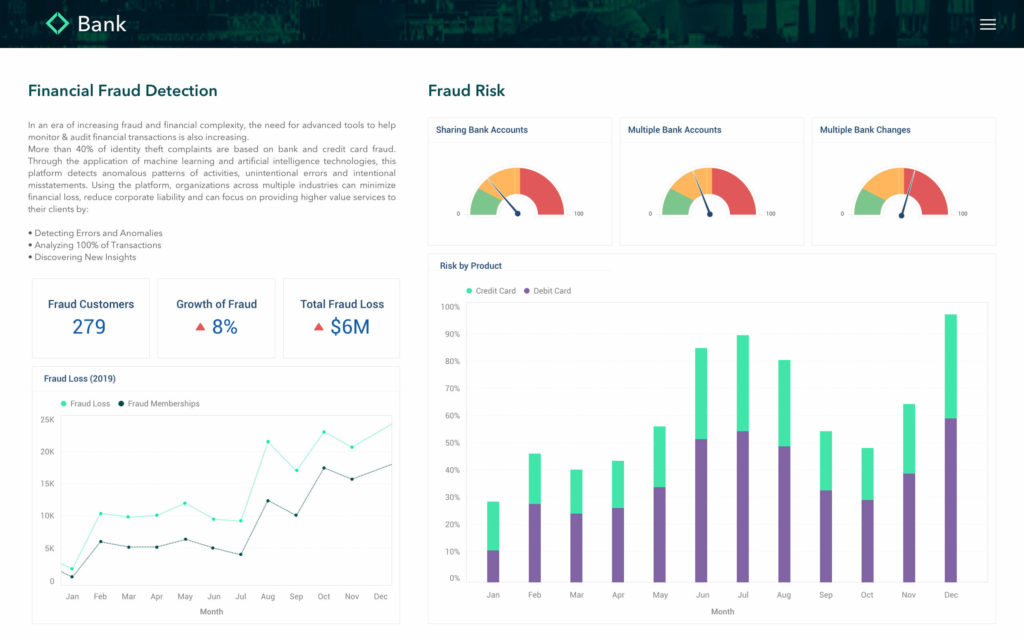
Analyze transaction data to find anomalies
Combine data sources to unify financial software

Security first with Qrvey’s embedded analytics for financial analytics solutions. Enable teams to safely analyze sensitive data within SaaS applications, from individual records to entire financial practice performance all within your SaaS platform.
Qrvey is deployed directly to AWS environments for industry-leading security and scalability for financial analysis software.
With Qrvey’s cloud-native solution built on AWS, there are no servers to manage. Resources scale automatically as your needs change. You get powerful analytics capabilities without large upfront investments.
Learn More About Qrvey’s Deployment Model
Qrvey connects to any data type – SQL, NoSQL, and unstructured data sources like forms and images – and enables analysis from multiple financial data sources on a single dashboard.
With an API layer built for rapid development, data can be pushed directly from the source for real-time analysis within your financial analyst software solution.
Learn More About Qrvey's Built-In Data Layer
The pixel perfect report builder enables you to build customizable report templates with precise control over the positioning and style of every element on the layout, down to the individual pixel.
Pixel perfect reports are important when the output must meet exact specifications, such as in audit reports, tax forms, regulatory documents, shipping labels, and more. This provides rigorous controls for formatting PDF and print output.
Learn More About Qrvey's Embedded Pixel Perfect Report BuilderQrvey connects directly to the AWS AI suite to power real-time machine learning augmentation for financial analysis software.
Since Qrvey deploys to your AWS VPC and analyzes financial data in real-time, this eliminates the need to copy data outside your AWS environment or use costly third-party ETL solutions with AI and ML.
Learn More About Qrvey’s Data Management
Qrvey enables a wide range of financial analytics use cases while prioritizing data security. Our software embeds interactive analytics directly into financial data analytics platforms. This integrated approach accelerates time-to-value since teams can immediately access analytics within familiar systems.
Automations and alerting keep you up-to-date
Analyze transaction data to find anomalies
Combine data sources to unify financial software

Ingest and analyze data with Qrvey’s API
Enable teams to drill-in to the lowest level of data
The best in security as your data stays in place
Spot trends early with comprehensive automations
Optimize real-time detection
Connect to AI services for in-depth analysis
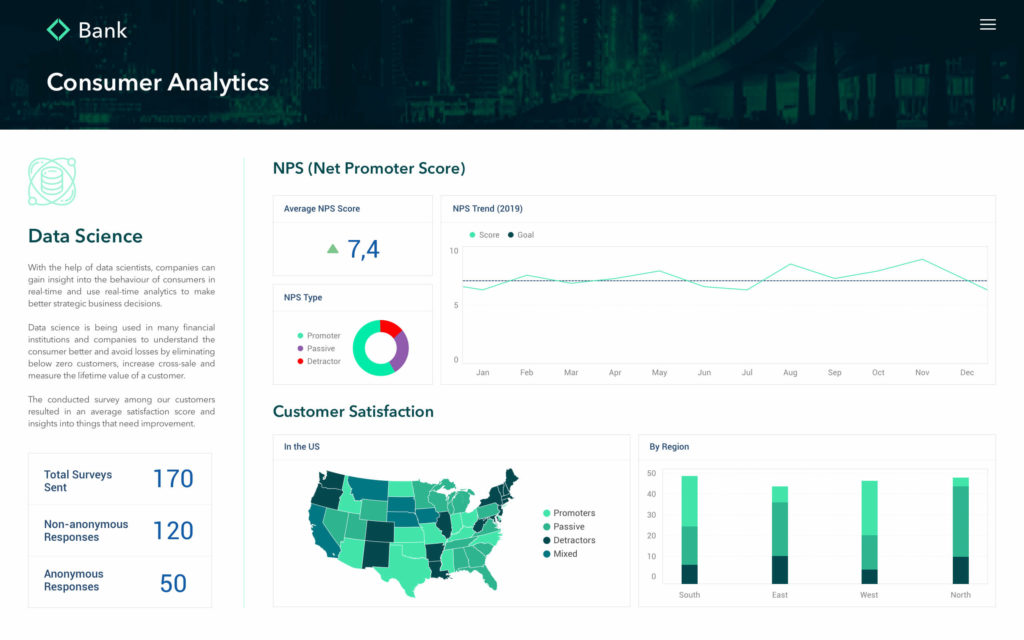
Collect real-time customer feedback
Analyze results as the data comes in
Alerting to keep processes inline
Download this extended report to learn how the Qrvey’s embedded analytics solution enables executives, CFOs, controllers, and more with a customizable solution to meet the varying financial data analytics needs of any team.
Download ReportFinancial analytics involves using statistical, predictive and optimization models to analyze financial performance and make data-driven business decisions. It entails gathering data from financial statements, budgets, investments, cash flows, transactions, etc. to evaluate risks, identify opportunities and forecast future performance.
Typical users of financial analytics include:
Some common use cases are:
Pixel perfect reporting is a term that refers to the precise and accurate rendering of reports, ensuring that every element, from text and images to layout and formatting, appears exactly as intended.