


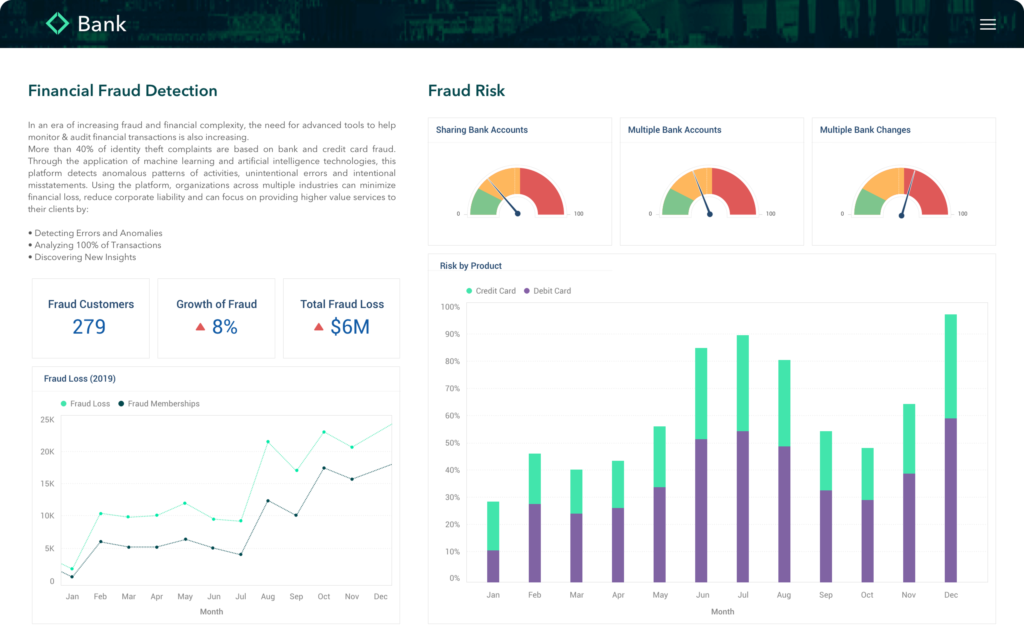
Embedded Data Visualization
Design Custom Experiences
Increase Customer Satisfaction.
Delight your end-users with the freedom to create any analytics experience within your SaaS application.
Put an End to Feature Requests
Customers are constantly asking for better reports, and those requests can dominate a roadmap.
Give them the tools to create reports specific to their needs.
More Choices
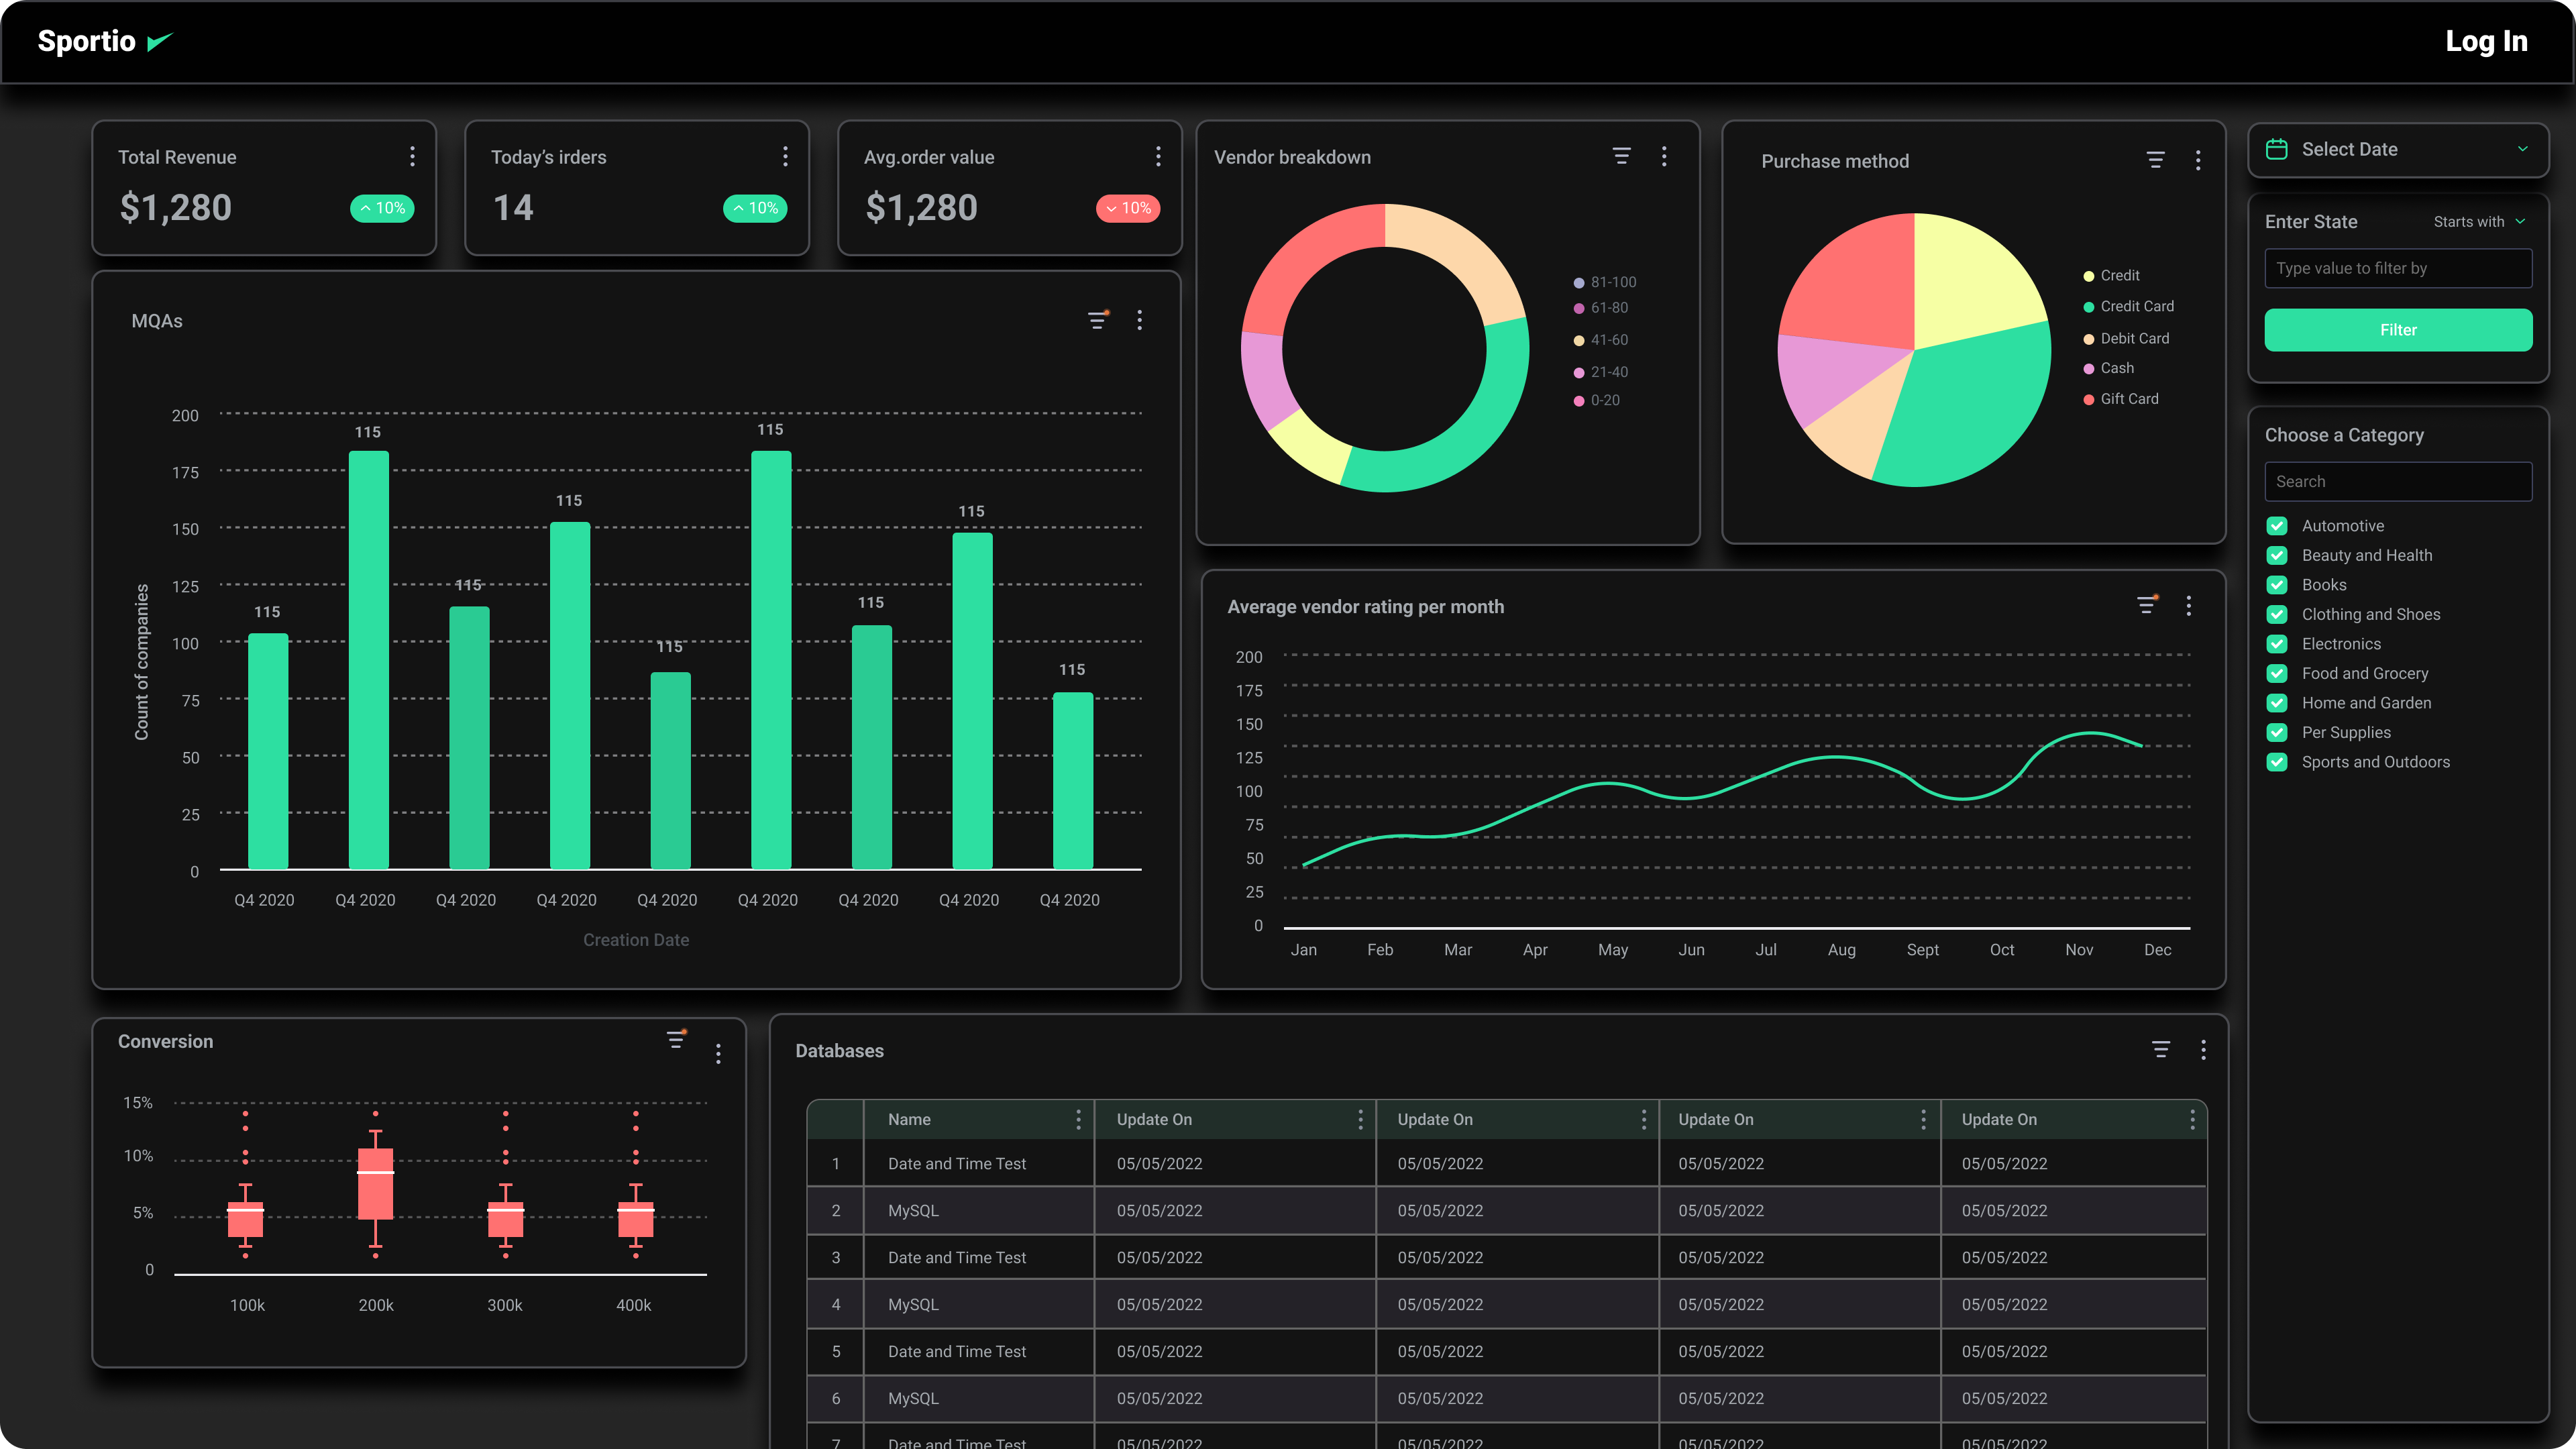
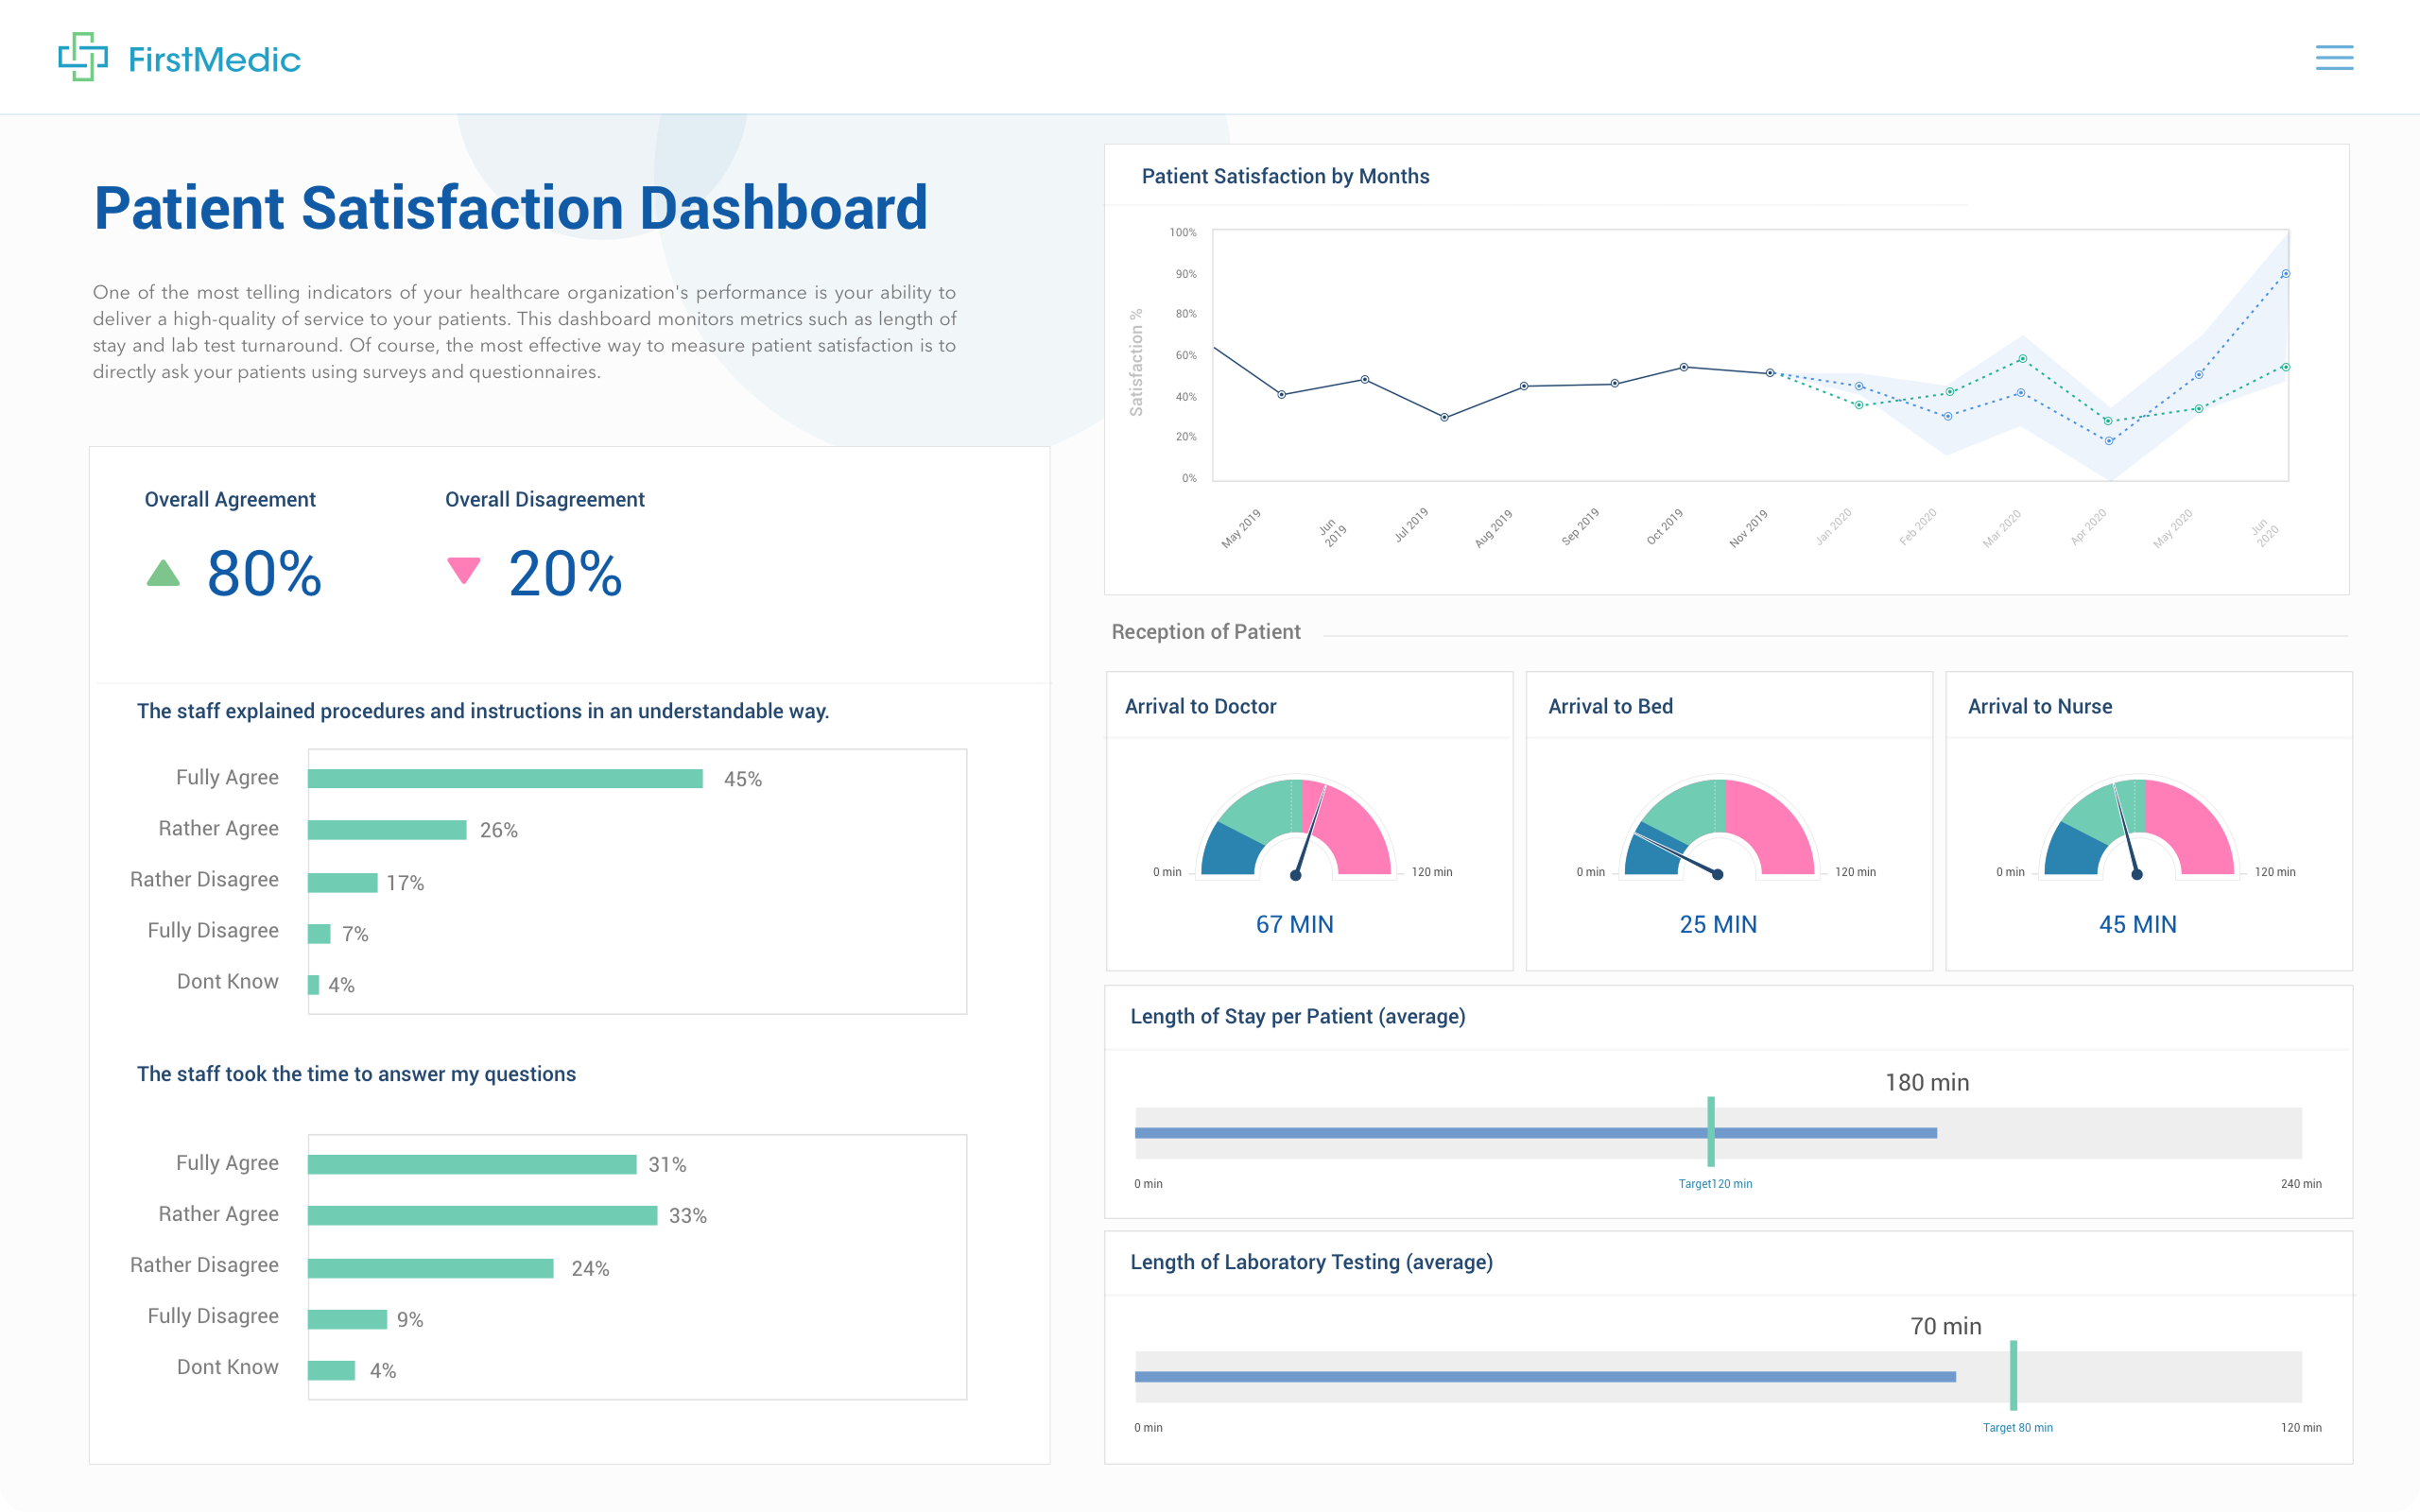
Choose from a wide variety of visualization options.
Dashboard Builders
Give end users the power to create dashboards within your SaaS app.
Granular User Permissions
Inherit security controls rather than duplicate users and roles.

Skip the Sales Demo.
Go to our demo center and walk-through our
interactive demo.
DATA VISUALIZATION SOLUTIONS
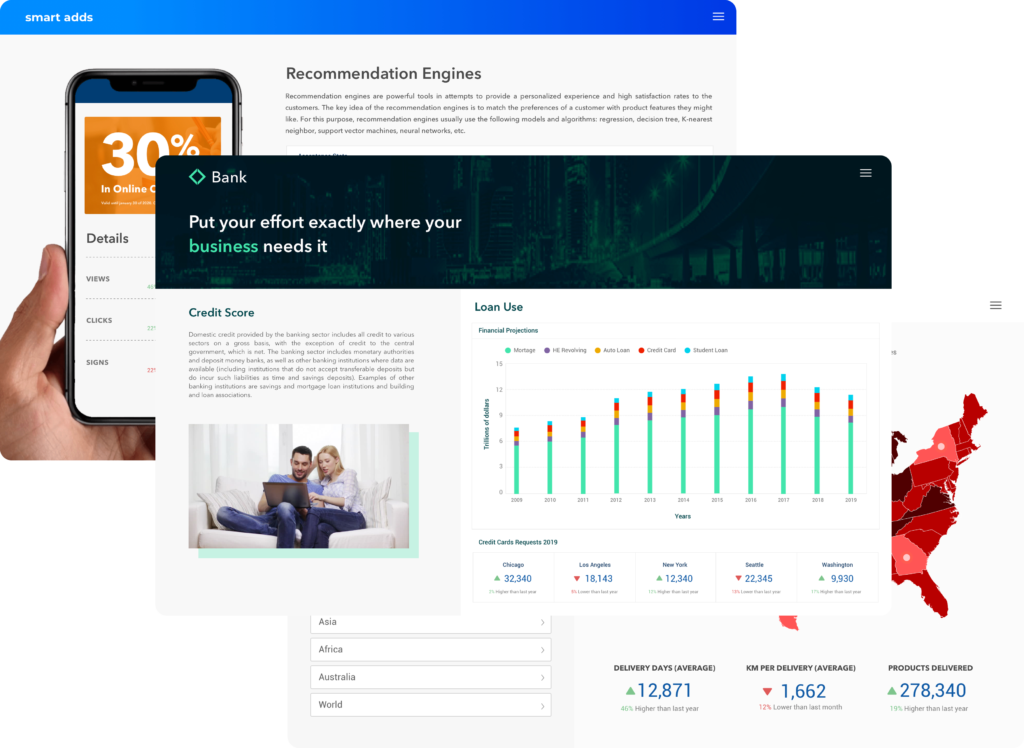
White Label For Seamless Integration
Third party solutions should blend in seamlessly. Qrvey offers full white label support to create dashboards and charts that look and feel like your SaaS application.

EMBEDDED DATA VISUALIZATION TOOLS
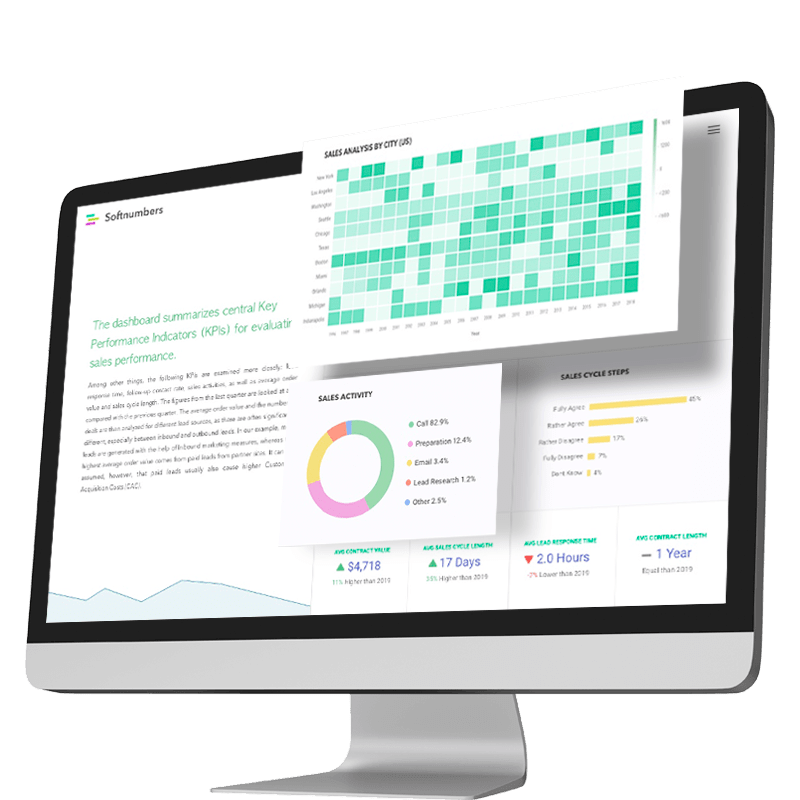
The Features Your Users Expect
Empower users to build their own dashboards or single charts with drill-ins, granular filtering, custom formulas and groups all with a responsive interface that works with any device.
DATA SECURITY
Easy to Implement Multi-Tenant Data Security
Restrict users to specific data. Permission data on multiple levels such as tenant, user role, or user group down to column and row level security.
VISUALIZATION SOLUTIONS
Create Templates
Product teams can create templates as starting points for users to build custom dashboards so they don’t have to start from a blank canvas.
CONTENT DEPLOYMENT
Target Specific Tenants with New Content
Achieve granular control over new content rollouts. This could be new templates, a beta rollout, or content only for specific premium tier customers.
PIXEL PERFECT REPORTS
Enable Users to Build Custom, Exportable Reports
Qrvey’s embedded, no-code pixel perfect report builder offers your users a simple way to build custom reports that need to meet specific design requirements.

See what our partners have to say

Herman Haynes
CIO @ Global K9 Protection Group
Adding Qrvey to our business was like turning on a light switch.

Ryan Quackenbush
Senior PM @ JobNimbus
We can’t speak highly enough of the stellar team at Qrvey. Within months of deploying Qrvey, JobNimbus achieved 70% adoption among large
enterprise users.

Dadou Jahanbani
CTO @ Impexium
Qrvey allowed Impexium to go to market quickly and get analytics into the hands of our customers.

Srinivasa Sridharan
CTO @ Setvi
Excellent product and customer support.
asasasasasasas sasasasas


More Insights

Why is Multi-Tenant Analytics So Hard?
BLOG
Creating performant, secure, and scalable multi-tenant analytics requires overcoming steep engineering challenges that stretch the limits of...

Pricing Strategies to Maximize Revenue from Analytics
GUIDE
Unlock the full potential of your SaaS business with our comprehensive guide on pricing and packaging strategies.

How JobNimbus deployed Qrvey to 6,000 customers
CASE STUDY
Discover how JobNimbus deployed Qrvey to 6,000 customers and saw an immediate reduction in customer churn....
FAQs About
Embedded Data Visualization
- Empowers users: Users can create custom dashboards tailored to their specific needs and insights, fostering data-driven decision-making within your user base.
- Reduces reliance on IT: Users can analyze data independently, decreasing the need for IT teams to create and maintain custom reports.
- Improves user engagement: Interactive visualizations make data exploration more engaging and accessible, leading to higher user adoption.
Qrvey offers all its embedded data visualization widgets as standard javascript-based embeds. Once Qrvey is installed within your cloud environment, it is easy to create a dataset and connect it to an embedded dashboard or a single chart by copying embed code to test it out.
Once ready, Qrvey’s embedded visualization widgets easily map to your security model so that security assertions are based with a JWT token at the time of rendering the visualization for maximum multi-tenant data security.
- Ease of use: The tool should be intuitive and user-friendly, even for non-technical users.
- Customization options: The tool should offer a variety of chart types and customization options to cater to different user needs.
- Integration capabilities: The tool should integrate seamlessly with your existing SaaS infrastructure and data sources.
- Security and governance: The tool should offer robust security features and access control mechanisms to protect sensitive data.
- Provide comprehensive training and resources: Offer tutorials, documentation, and workshops to help users learn how to use the tools effectively.
- Showcase success stories: Highlight how other users have benefitted from self-service analytics to inspire adoption.
- Gather feedback and iterate: Continuously gather user feedback and update the tools and resources based on their needs.
See Qrvey in Action
Learn about Qrvey’s AI-native embedded analytics platform and get quick answers to your questions by booking a guided product tour with our experts.