Deliver embedded dashboards users actually want to use.
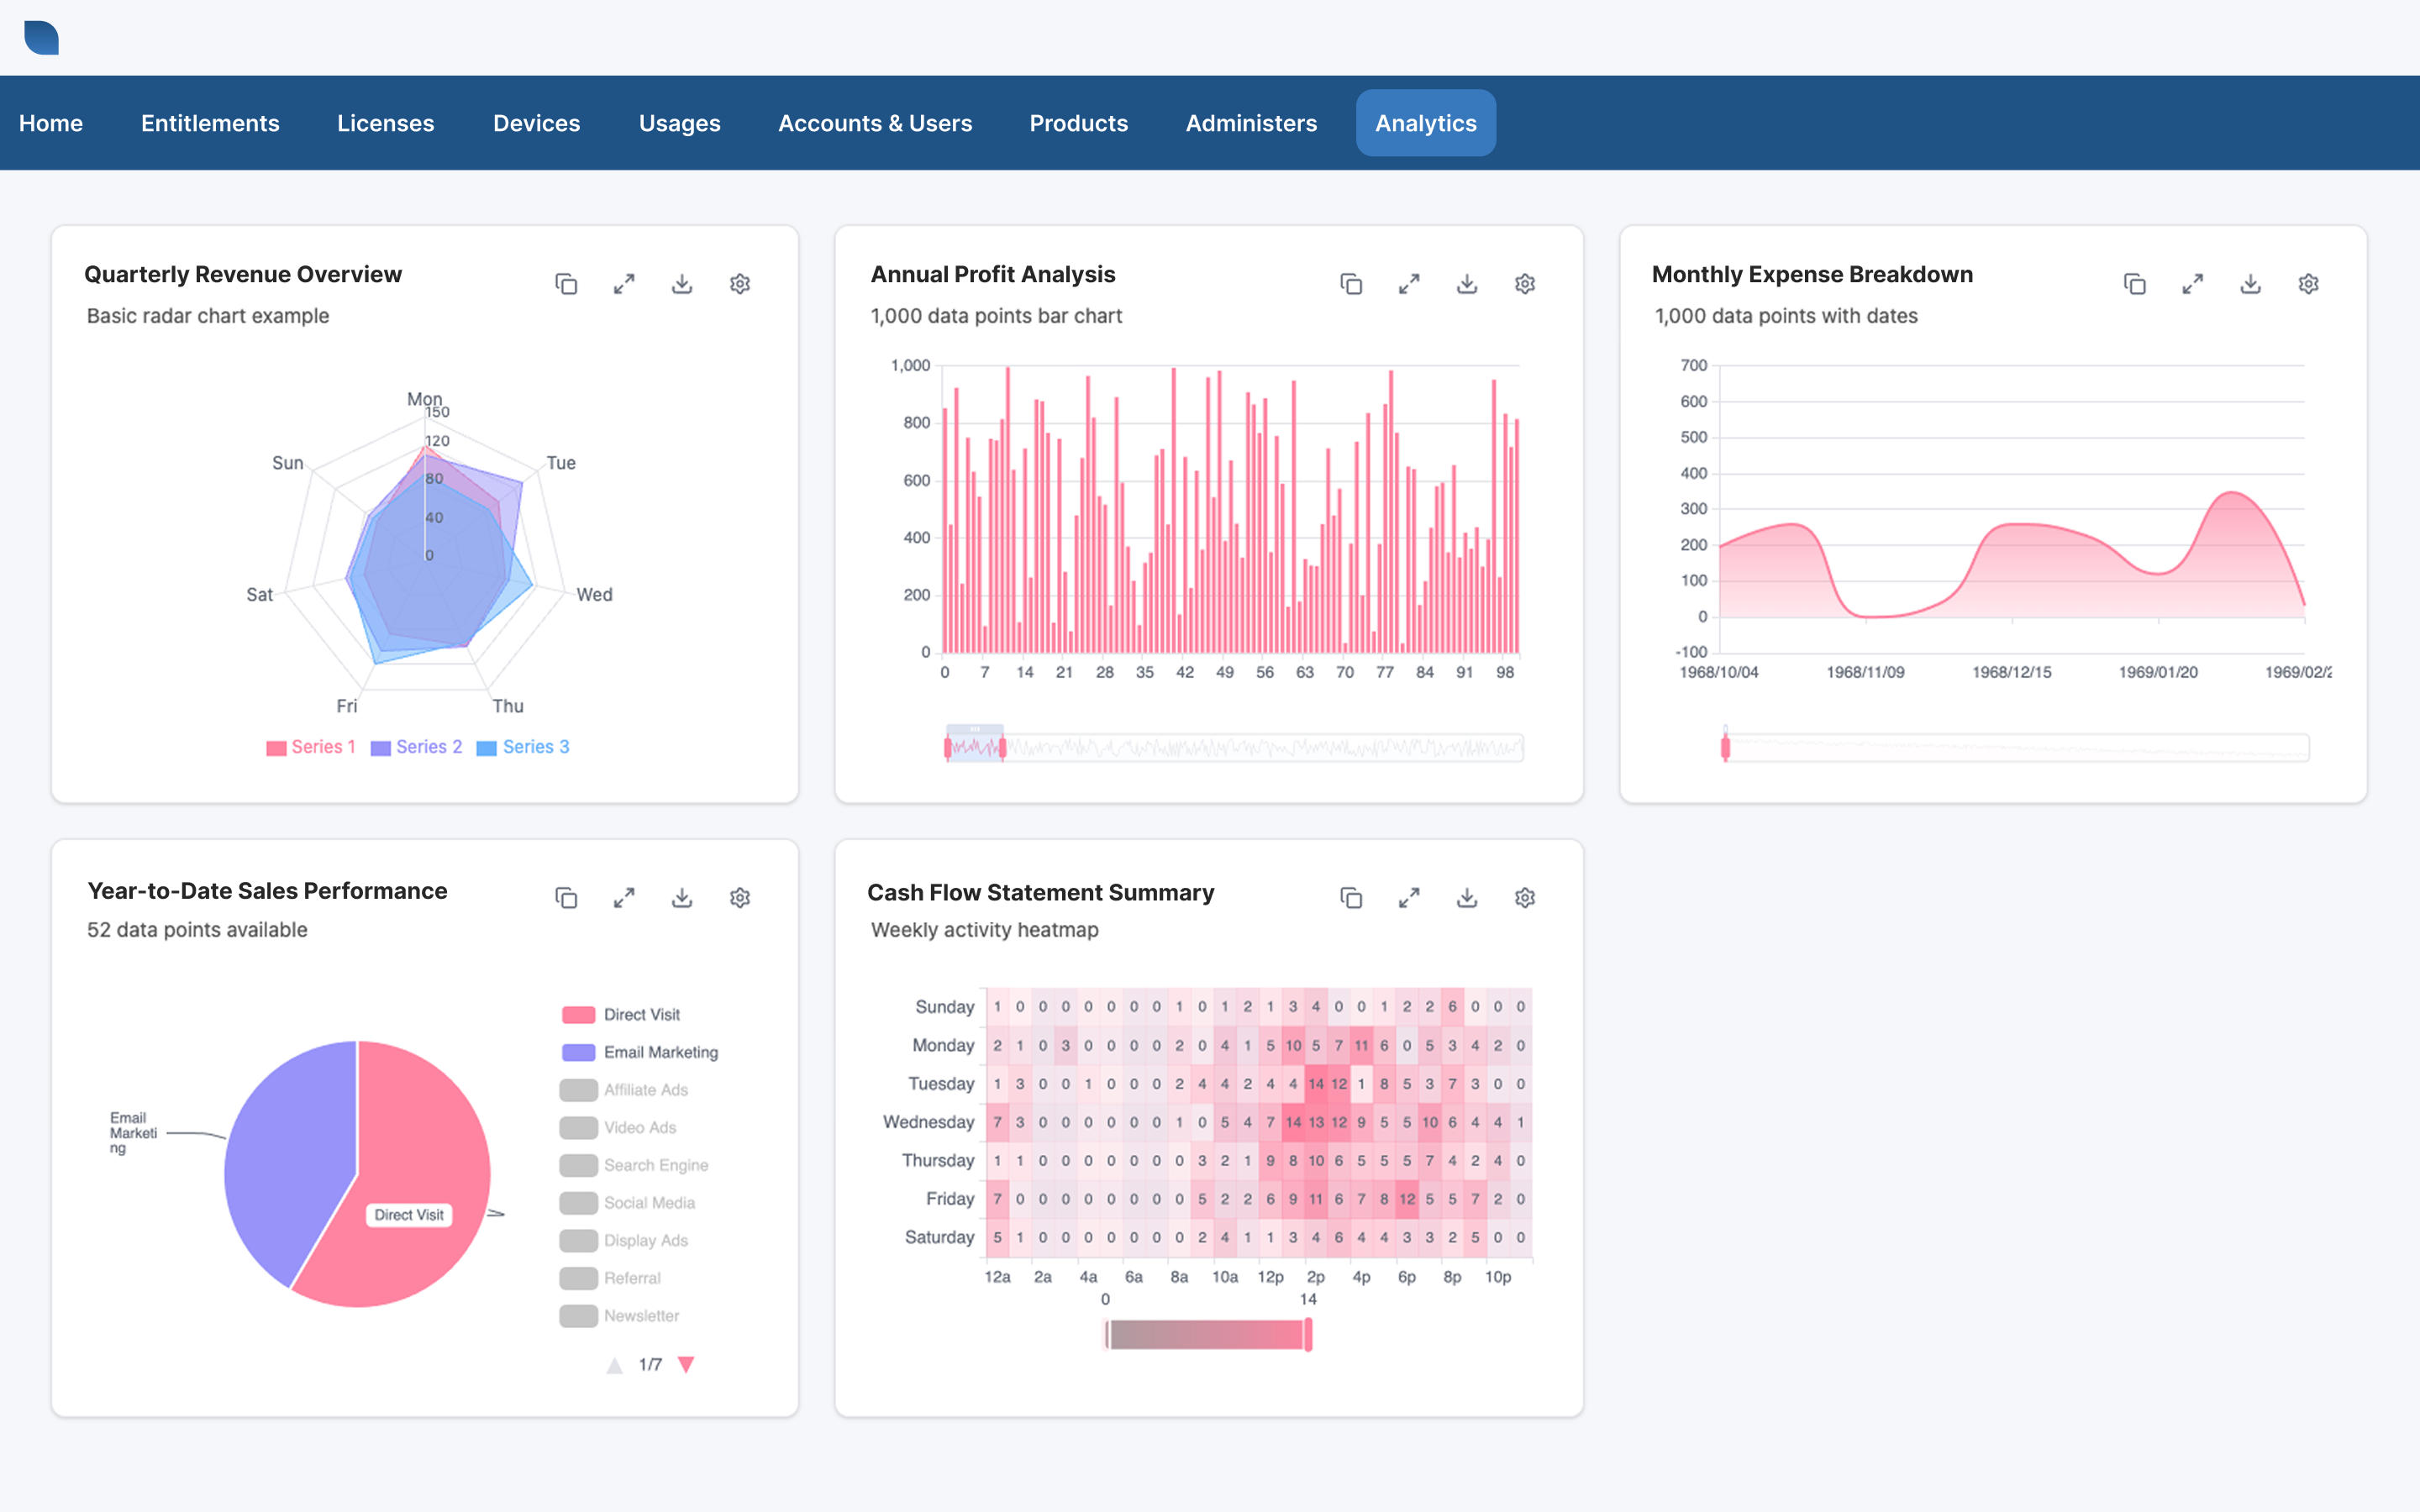
Embed interactive data visualizations directly into your SaaS product with a native UX that keeps customers engaged inside your product.
Empower users to create, customize, and share dashboards and datasets, explore insights through conversational AI and agents, and maintain full control through multi-tenant security and governance.


Most embedded dashboards stop at “good enough.”
Adding charts to a SaaS product sounds simple — until customers expect more. Users want interactive dashboards, custom reports, filtering, drill-downs, exports, personalization, and self-service analytics that feel native to your product experience.
Meanwhile, engineering teams are stuck maintaining visualization libraries, permissions, APIs, performance optimization, and tenant-specific configurations. What starts as a dashboard project quickly becomes a long-term analytics platform commitment.
SaaS product teams need customers to shape their own analytics — dashboards, views, even datasets — without creating a backlog for the product team. Your product team needs clear guardrails over what users can see, create, and share, so self-service accelerates adoption without introducing risk.
Embedding charts that don't feel native to the product experience.
Supporting self-service reporting without creating security risks.
Managing tenant-specific dashboards and permissions across customers.
Handling large datasets and performance at scale.
Maintaining front-end visualization frameworks over time.
Meet Qrvey's Embedded Data Visualization Platform.
Qrvey gives SaaS teams a complete embedded analytics and data visualization layer purpose-built for customer-facing applications. Instead of building visualization infrastructure internally or embedding disconnected BI tools, you get interactive dashboards, reports, APIs, and embedded components designed specifically for multi-tenant SaaS.
Deliver analytics experiences that feel native to your product while maintaining control over branding, scalability, and multi-tenant security. Product teams define the data models, permissions, and guardrails — and within those boundaries, customers can explore data, build dashboards, customize views, and answer questions through conversational analytics, all without compromising governance.
- Embed interactive dashboards directly into their application
- Deliver branded analytics experiences that feel native
- Support self-service exploration and reporting
- Personalize visualizations by tenant, role, or user
- Reduce engineering overhead tied to analytics infrastructure
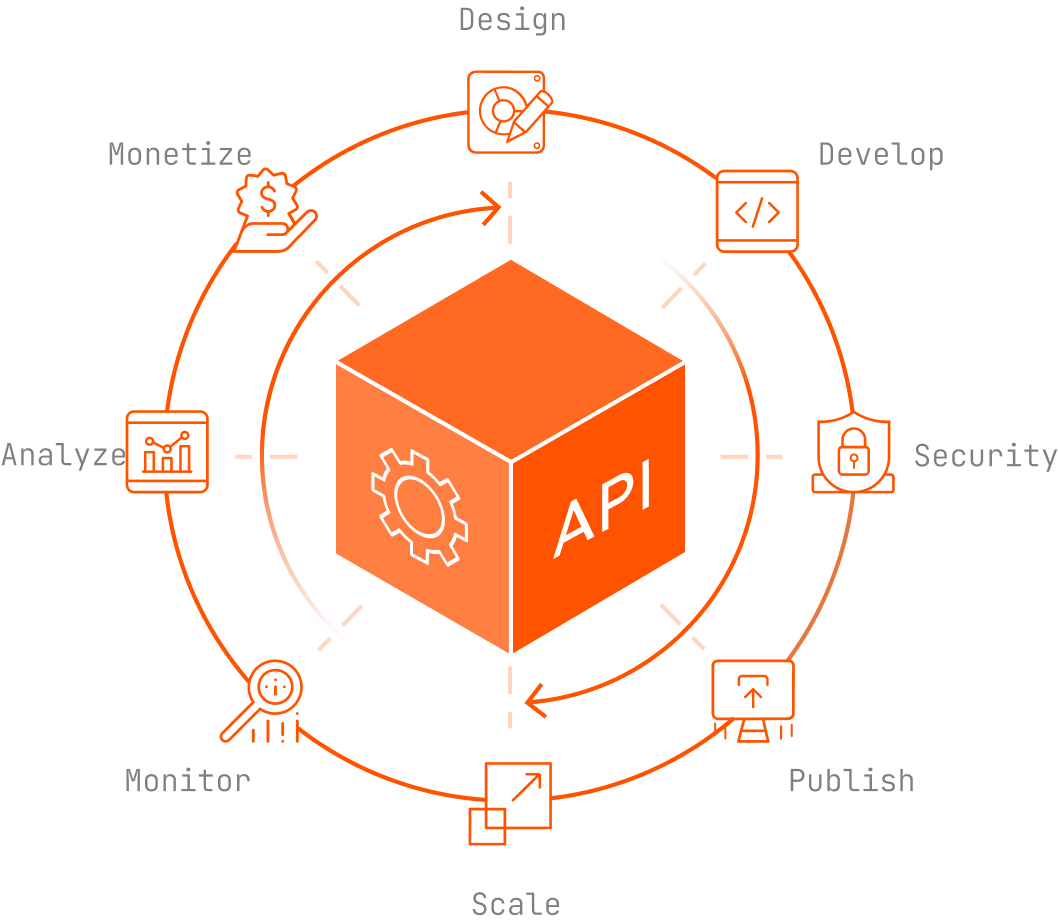
From your data sources to a native customer experience.
Bring together data from warehouses, databases, APIs, and cloud applications into a centralized analytics layer designed for customer-facing use cases.
Create dashboards, charts, filters, and reports optimized for embedded experiences. Support modern analytics interactions including:
- Filtering
- Drill-downs
- Cross-dashboard navigation
- Exports
- Dynamic widgets
- Real-time updates
Product teams can enable AI-powered analysis and visualization agents that help users discover trends, answer questions, and generate new visualizations from governed data sources.
Dashboards, reports, and builders are embedded directly into the application, preserving a native user experience. Use embedded components and APIs to integrate dashboards and visualizations directly into your application experience.
Maintain consistent branding, navigation, and workflows across your platform.
Deliver different dashboards, permissions, and analytics experiences by tenant, user role, or subscription tier.
Everyday users explore their data. Power users create and customize dashboards and views by embedding the dashboard builder — always within product-defined rules.
AI experiences can also be tailored by tenant, role, or use case. Product teams can deploy custom agents that understand customer-specific terminology, metrics, and workflows while operating within the same permissions and tenant boundaries that govern visualizations.
Six capabilities that turn embedded data visualizations into experiences customers actually use.
Deliver analytics experiences where users can explore data in context, gaining insight directly inside product workflows.
- Interactive charts and widgets
- Dynamic filtering and drill-downs
- Responsive dashboards
- Real-time data updates
- Cross-dashboard navigation
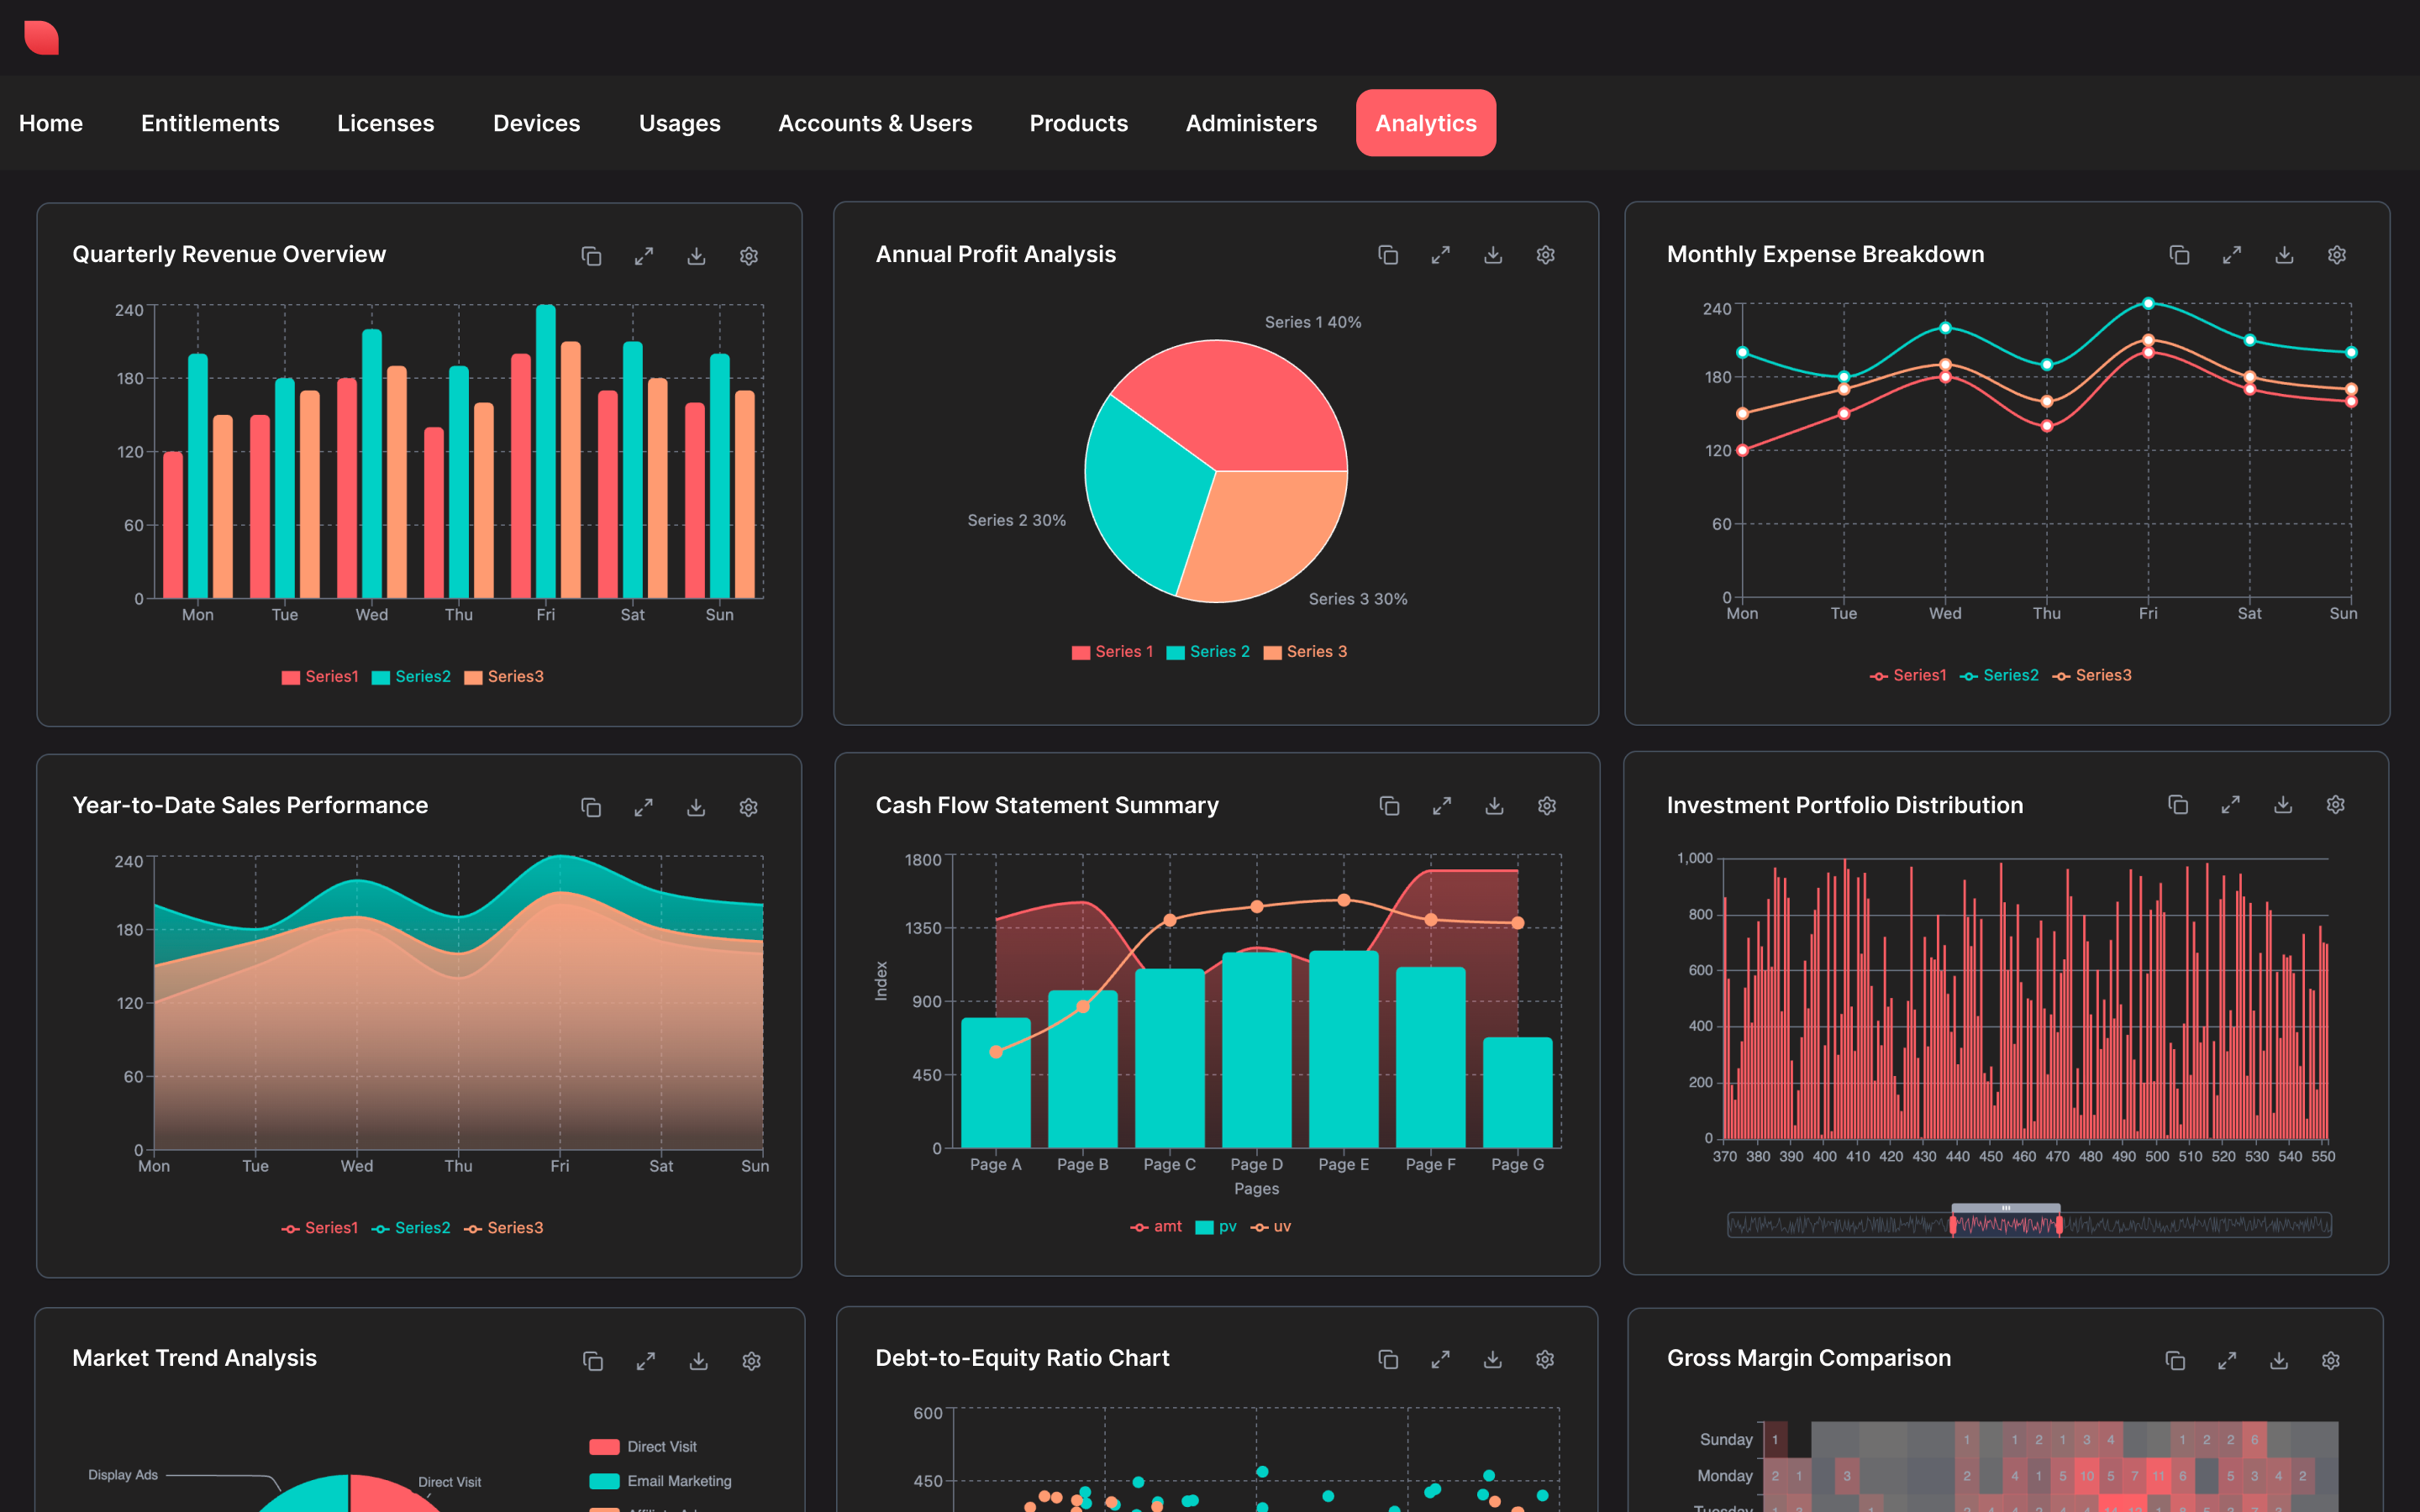
Embedded analytics should feel like part of your product — not a separate tool.
- White-label embedded UI
- Custom branding and styling
- Embedded web components
- Flexible layout control
- Seamless user experience
Give customers more flexibility without increasing engineering dependency.
- Dashboard creation and customization
- Dataset creation
- Saved reports and views
- AI-assisted ad hoc exploration
- User-level personalization
- Tenant-specific analytics experiences
Help users move from data to insight faster.
- Conversational analytics with Qrvey Sidekick
- Generate charts and dashboards using natural language
- Built-in and custom AI agents
- Governed access through Qrvey's MCP server

Deliver analytics securely across customers and users.
- Tenant-aware permissions
- Role-based access controls
- Dataset-level security
- User-specific visibility rules
- Secure embedded access
Integrate analytics into your product architecture without rebuilding visualization infrastructure.
- Embedded APIs
- Automation APIs
- Reporting APIs
- Front-end embedding support
- Deployment and management APIs
Built for SaaS applications — not internal BI.
Homegrown analytics and limited embedded tools deliver safe but static dashboards that quickly turn into a backlog.
Other approaches promise self-service, but fall short when governance and guardrails aren't strong enough for multi-tenant SaaS.
Qrvey is different. It delivers true self-service visualization — dashboards and datasets — within product-defined models and guardrails, so customer autonomy scales without sacrificing control.
Embedding generic BI dashboards.
Embedded visualizations designed specifically for customer-facing SaaS applications.
Maintaining custom chart libraries.
A complete embedded analytics infrastructure layer.
Forcing users to navigate dashboards alone.
Visual analytics combined with conversational exploration and AI-guided analysis — all within the same governed analytics experience.
iframe-based experiences.
Branded, integrated analytics experiences that feel native to your product.
Limiting users to static dashboards.
Interactive and self-service analytics experiences at scale.
Designed for real SaaS product experiences.
Customer-facing analytics dashboards
Give customers visibility into KPIs, trends, and operational metrics directly inside your application.
Embedded operational reporting
Deliver reports and analytics where users already work.
Self-service reporting
Allow users to customize and explore analytics independently.
Executive dashboards
Provide leadership teams with embedded performance visibility across accounts, teams, and workflows.
AI-powered analytics experiences
Combine embedded visualizations with conversational AI and intelligent workflows.
What they say when we're not in the room.
The team at Qrvey made it very easy to learn how handling multi-tenancy would work. The documentation and structure were simple to follow, and when we had questions, they were clarified quickly so we could just get to work and get it done. That was really important, and it was just simple to follow and understand.

Built for scalable SaaS analytics delivery.
Qrvey is designed for SaaS teams that need to embed analytics securely across many customers — while maintaining control over infrastructure, permissions, and deployment.
Qrvey data visualization operates within product-defined models for roles, permissions, and data access, supporting secure, governed self-service visualization as usage scales across users, organizations, and tenants.
Frequently
Asked
Questions
Embedded visualizations are step one.
Let us walk you through the rest.
See how Qrvey combines embedded dashboards with self-service exploration, governed AI, and multi-tenant security — and how SaaS teams use the full platform to deliver the experience customers stay for.
Runs in your cloud, not ours