Embedded Analytics Gallery
Our analytics, integrated seamlessly in your application. With Qrvey, you can design endless analytics experiences and integrate them seamlessly into your application.
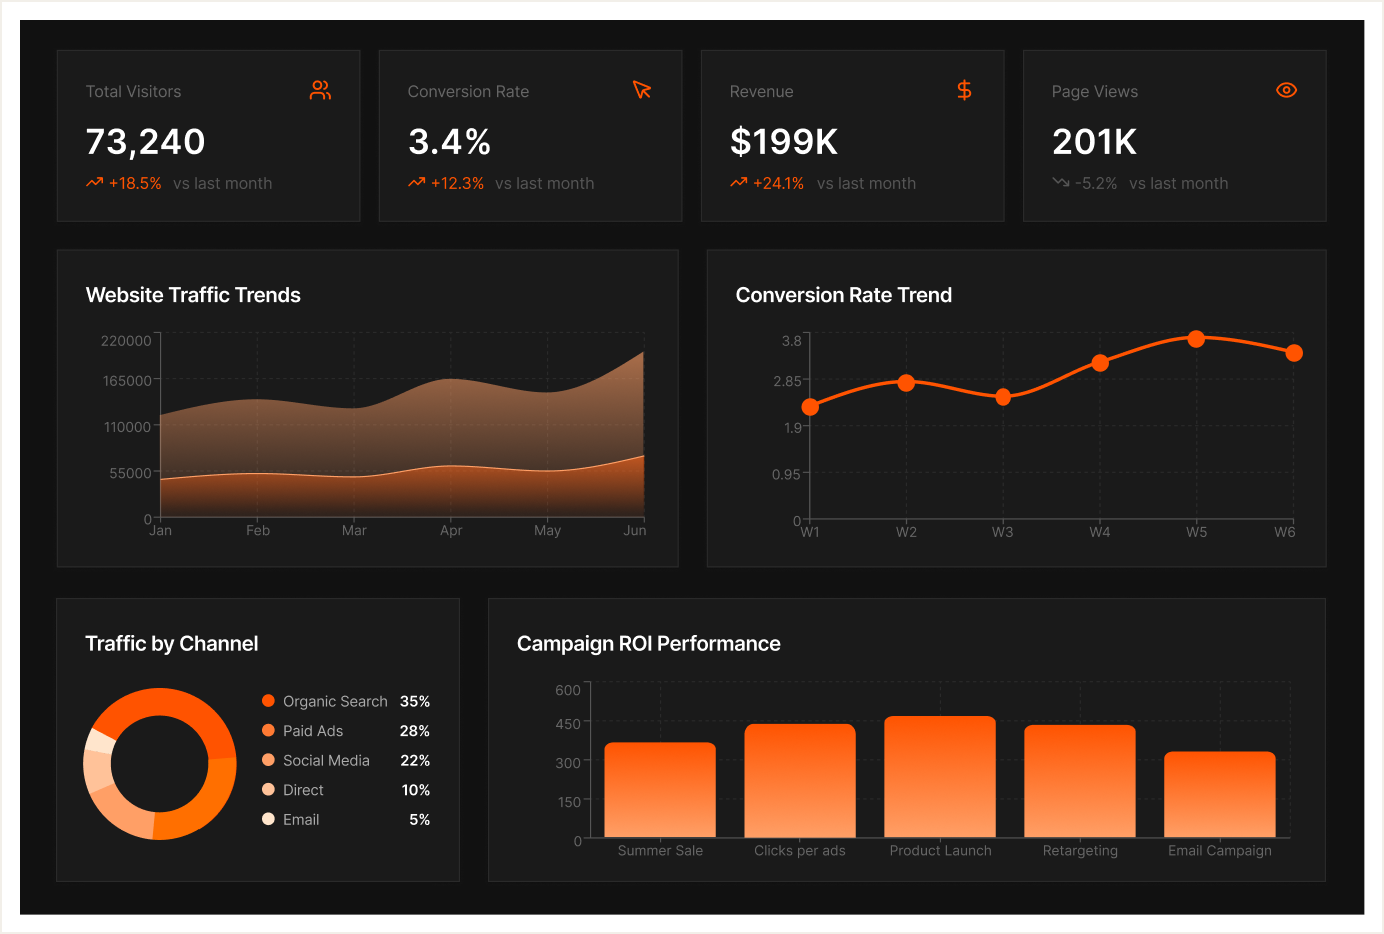
Embedded Data Visualization Examples Your Users Will Love
Great embedded analytics starts with great data visualizations. That’s why the Qrvey platform provides dozens of beautiful charts, gauges and visualizations, all of which are fully interactive and can be easily embedded inside your application.
Qrvey gives you the freedom to create the user experience that’s right for your SaaS application.
Still here?
That's a good sign.
AI-Native Self-Service · 100% Embedded · Multi-Tenant · Flat-rate Licensing · Built-In Data Pipeline