


⚡Key Takeaways
- Qrvey is best for SaaS companies needing embedded analytics with full white-label customization and multi-tenant security
- ThoughtSpot excels for enterprises wanting AI-powered search capabilities with natural language processing for data queries
- Looker Studio suits small businesses needing free data visualization with Google Cloud integration and basic reporting
- Tableau works for organizations requiring sophisticated and comprehensive visual analytics for data analysts
Domo is a good product and it is highly used across many large and small organizations, mostly for their internal use cases. However, it prioritizes ease-of-use over power and flexibility.
You might be one of those people who feel your team spends more time fighting with Domo’s interface than actually analyzing data. Between the confusing pricing model, limited customization options, and poor embedded analytics experience, you’re ready for a change.
Thousands of companies are discovering better Domo alternatives that prioritize usability without sacrificing power. This guide reveals six options that deliver better user experiences, clearer pricing, and stronger features for specific use cases.
We’ve reviewed each option with pricing info, customer reviews, and honest assessments of where they excel and where they fall short. By the end, you’ll know exactly which alternative fits your team’s needs.
| Tool | Best for | Stand out feature | Starting price |
|---|---|---|---|
| Qrvey | SaaS companies needing embedded analytics | Full white-label customization with multi-tenant security and embedded AI | Two pricing packages available with unlimited everything. Request pricing |
| ThoughtSpot | Organizations wanting AI-powered search | Natural language query processing | $25/month |
| Looker Studio | Small businesses needing basic reporting | Free tier with Google ecosystem integration | Free |
| Luzmo | SaaS teams requiring quick dashboard embedding | Drag-and-drop dashboard creation | $995/month |
| Omni Analytics | Mid-market companies with modern data stacks | Semantic layer with dbt integration | Custom pricing |
| Tableau | Enterprises needing advanced visualizations | Sophisticated data modeling capabilities | $35/month |

Qrvey
Your SaaS customers keep asking for better reporting features. They want custom dashboards, automated alerts, and the ability to dig deeper into their data. But every time you try to embed traditional BI tools into your product, the experience feels clunky and disconnected. And your dev team gets delayed with building workarounds.
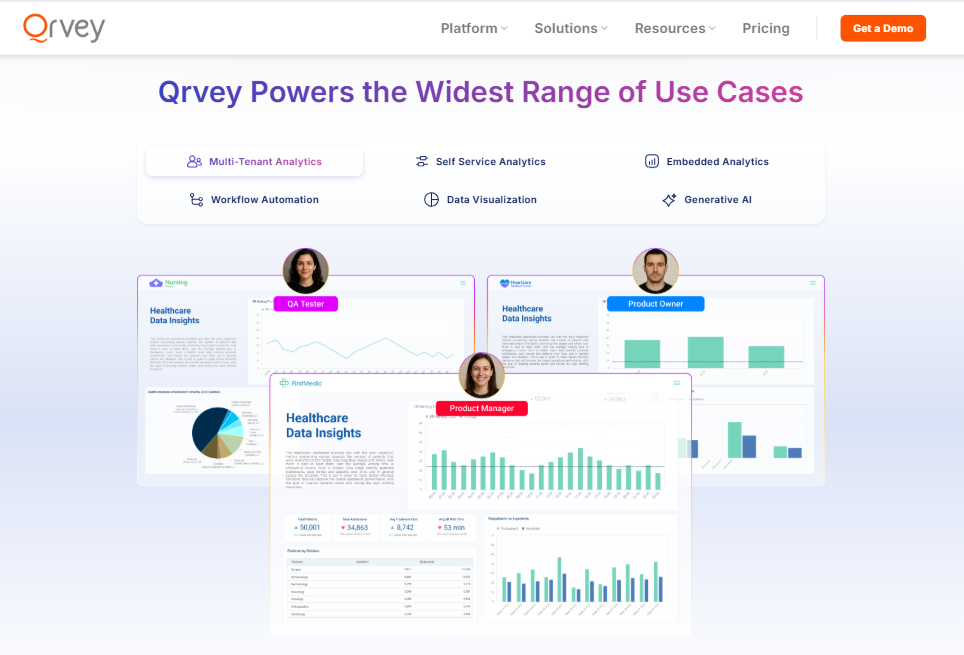
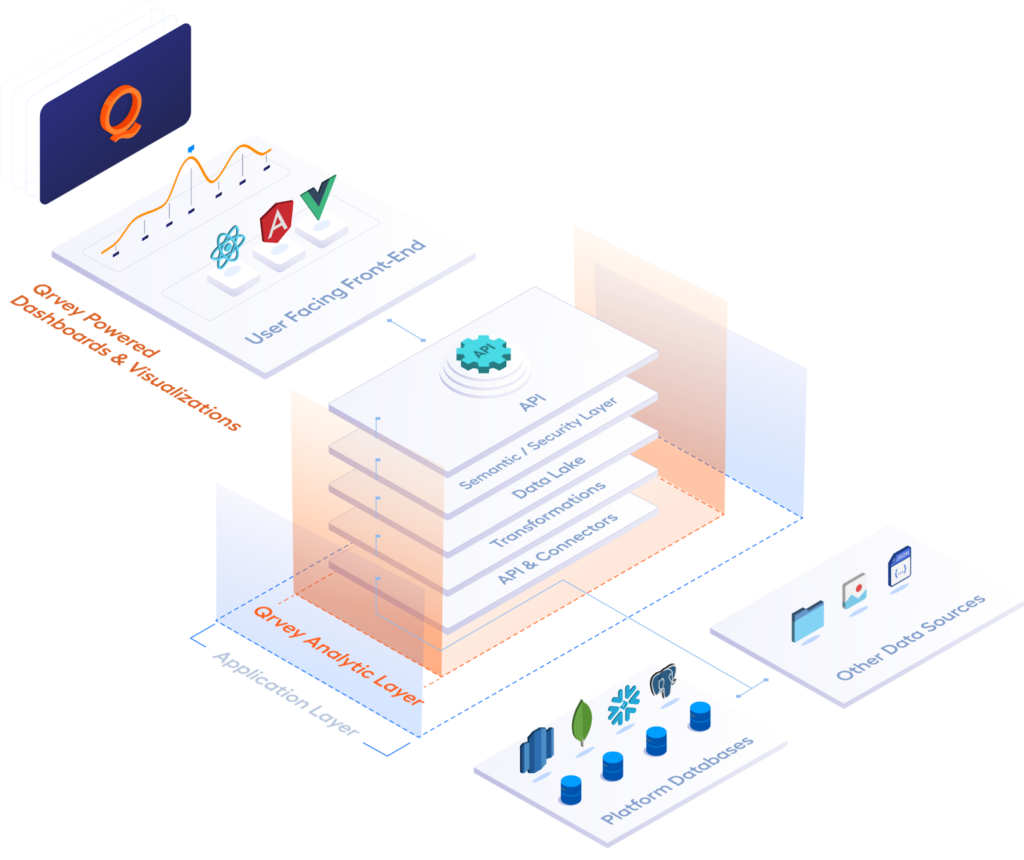
Qrvey solves this problem by providing a complete embedded analytics platform designed specifically for SaaS companies. Instead of forcing your users to navigate third-party interfaces, Qrvey delivers white-label, self-service analytics that feel like a natural part of your application.
Key Features
Qrvey’s strength lies in how much it takes off your plate. You don’t need to build and secure your own data lake, worry about tenant-level permissions or design visualizations from scratch. These features are pre-packaged, ready to embed, scale, and govern.
- Multi-Tenant Data Lake Built for SaaS
Most analytics tools struggle with multi-tenancy. You end up building complex workarounds to keep customer data separate while maintaining performance. Qrvey’s native multi-tenant architecture handles this automatically.
See how Qrvey approaches Row Level Security in this clickable demo.
The platform creates isolated data environments for each of your customers while sharing compute resources efficiently. This means Customer A can’t see Customer B’s data, but both get lightning-fast query performance. Your engineering team doesn’t need to build custom security models or worry about data leakage.
- No-Code Dashboard Builder That Actually Works
Your product team can create professional dashboards without writing code. The drag-and-drop interface includes pre-built components for common SaaS metrics like user engagement, churn rates, and revenue tracking.

What makes it especially different is the dashboards embed seamlessly into your existing UI. No iframes, no jarring design breaks. Your customers see analytics that look and feel like part of your core product.
- Workflow Automation Beyond Basic Alerts
Static reports are useful, but automated workflows drive real business value. Qrvey’s automation platform triggers actions based on data insights.
See how simple it is to build a Qrvey workflow in this clickable demo.
Set up notifications when customer usage drops below threshold levels. Automatically generate reports when monthly targets are hit. Create custom workflows that connect your analytics to other business systems like CRMs or marketing automation tools.
- Developer-Friendly APIs and Deployment
Your engineering team gets the flexibility they need. Qrvey provides robust APIs for custom integrations and a SQL editor for complex queries. The platform deploys to your cloud environment, so you maintain control over your data.
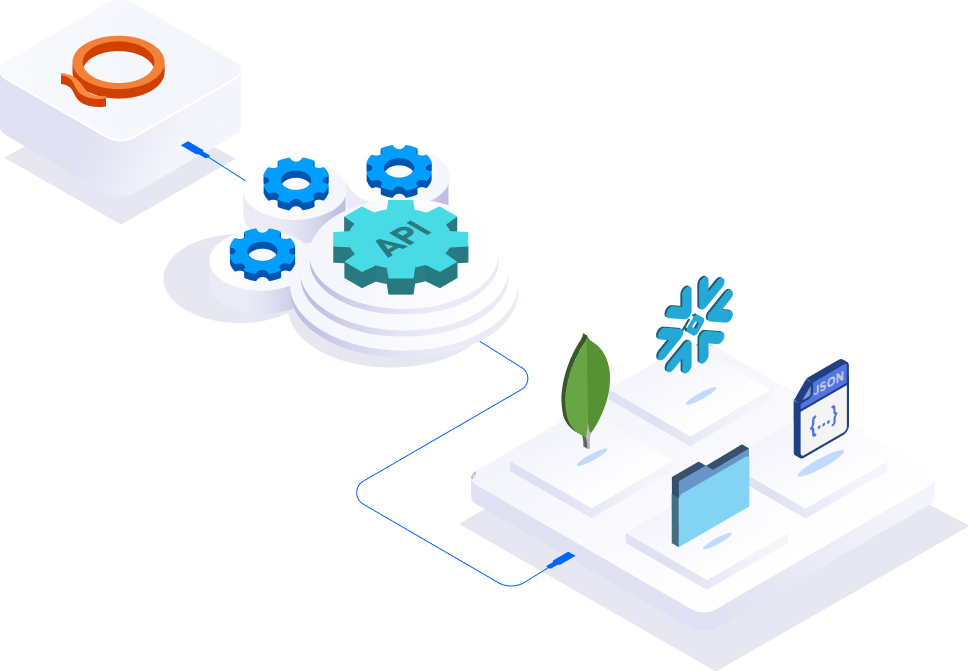
Container-based architecture means the system scales automatically as your user base grows. You don’t need to worry about performance bottlenecks or infrastructure management.
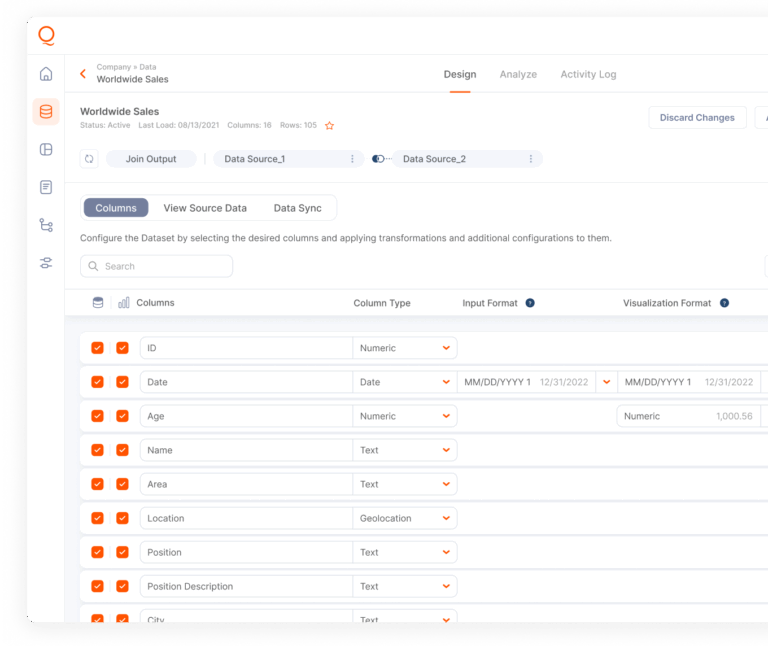
- Advanced Data Management Features
Qrvey handles the complex data engineering tasks that usually require dedicated teams. The platform includes ETL tools for connecting various data sources, data transformation capabilities, and a semantic layer for consistent definitions across all reports.
The system supports real-time data synchronization, so your customers always see up-to-date information. You can connect to data warehouses, APIs, databases, and files without building custom connectors.
Explore how a GenAI analytics platform can simplify this process and suggest optimizations automatically.
Pricing
Qrvey offers two distinct plans with flat-rate pricing that includes unlimited tenants, users, and dashboards. This pricing model drives SaaS scalability and profitable growth without per-user fees.
| Plan | Features | Price |
|---|---|---|
| Qrvey Pro | Self-service embedded analytics, pixel-perfect reporting, AI-driven insights, workflow automation, semantic layer, multi-tenant security | Custom quote |
| Qrvey Ultra | Everything in Pro plus data transformation layer, built-in data engine, complete full-stack analytics | Custom quote |
Where Qrvey Shines
- Seamless Integration: Qrvey’s embedded cloud native analytics architecture means faster implementation than building analytics in-house. Most customers see deployment within weeks.
- Developer-Friendly Architecture: Its container-based infrastructure scales automatically with your application. Qrvey inherits your existing security policies and deploys directly to your cloud environment.
- Complete Data Pipeline: Unlike other embedded analytics solutions, Qrvey includes a full data management layer. You get ETL tools, data transformation capabilities, and a data lake optimized for multi-tenant use cases.
Where Qrvey Falls Short
- Specialized Focus: Primarily designed for embedded analytics rather than internal business intelligence.
- Limited Offline Capabilities: The platform requires internet connectivity for full functionality, which may limit use cases in environments with poor connectivity.
Customer Reviews
“We can’t speak highly enough of the stellar team at Qrvey. Within months of deploying Qrvey, JobNimbus achieved 70% adoption among large enterprise users.” – Ryan Quackenbush, Senior PM @ JobNimbus
“Excellent product and customer support.” – Srinivasa Sridharan, CTO @ Setvi
Who Qrvey Is Best For
- SaaS Product Managers: Teams needing to differentiate their analytics experience and reduce feature request backlogs
- Engineering Leaders: Development teams wanting to avoid building multi-tenant analytics from scratch
- Enterprise Software Companies: Organizations requiring enterprise-grade security with white-label customization
Get your free personalized demo today before another feature request delays the roadmap.
ThoughtSpot
ThoughtSpot takes a different approach to analytics by letting users search for insights using plain English. Instead of building complex reports, users type questions like “show me sales by region last quarter” and get instant visualizations.
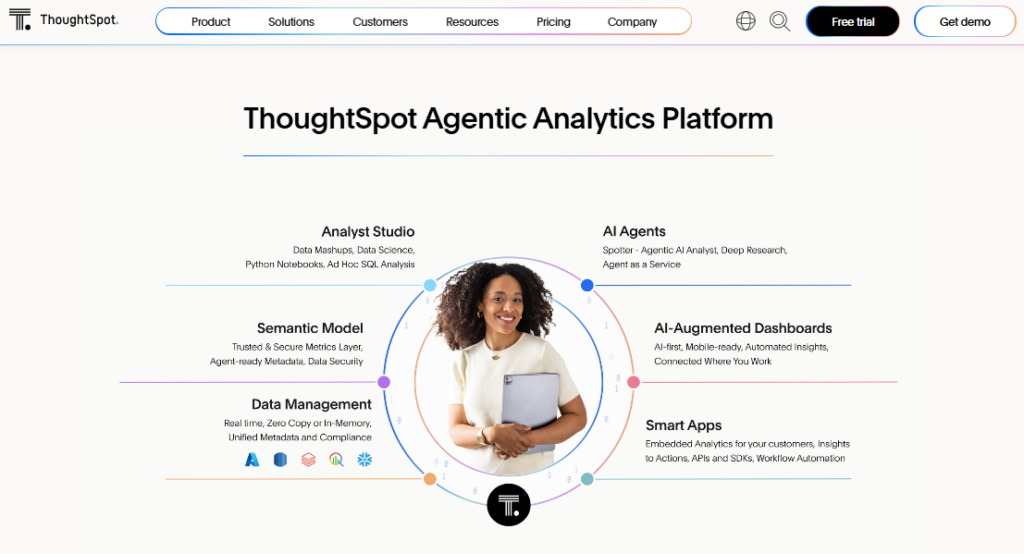
The platform’s AI-powered search engine converts natural language into complex queries, making data analytics accessible to non-technical users. This democratization of data can reduce bottlenecks in your analytics workflow.
Key Features
- AI-Powered Search: Natural language processing converts questions into complex data queries
- Spotter AI Agent: Autonomous analytics that identifies trends and anomalies automatically
- Interactive Liveboards: Real-time dashboards that update as new data flows in
- Embedded Capabilities: Options for integrating insights into existing applications
Pricing
| Plan | Monthly cost | Users | Data rows |
|---|---|---|---|
| Essentials | $25 per user | Up to 50 | 25 million |
| Pro | $50 per user | Up to 1000 | 250 million |
| Enterprise | Custom | Unlimited | Unlimited |
Where ThoughtSpot Shines
- User Adoption: Non-technical users can perform complex analytics without learning SQL
- Speed to Insights: AI-powered search delivers results in seconds
- Strong Support: Comprehensive customer success program with dedicated account management
Where ThoughtSpot Falls Short
- Advanced Analytics: Complex predictive analytics require additional setup and expertise
- Software Reliability: Users report occasional bugs that affect daily workflows
- Learning Curve: Advanced features still require significant training investment
Customer Reviews
“Sometimes, more complex issues take longer to fix especially if they need engineering support. But the team is always responsive and keeps me updated, so it’s not too bad.” – Verified G2 user
Who ThoughtSpot Is Best For
- Business Analysts: Need self-service analytics without technical dependencies
- Data-Driven Organizations: Want to democratize analytics across non-technical teams

Looker Studio
Google’s free business intelligence platform transforms data into interactive dashboards through a drag-and-drop interface. For teams already using Google Cloud services, Looker Studio provides seamless integration without additional costs.
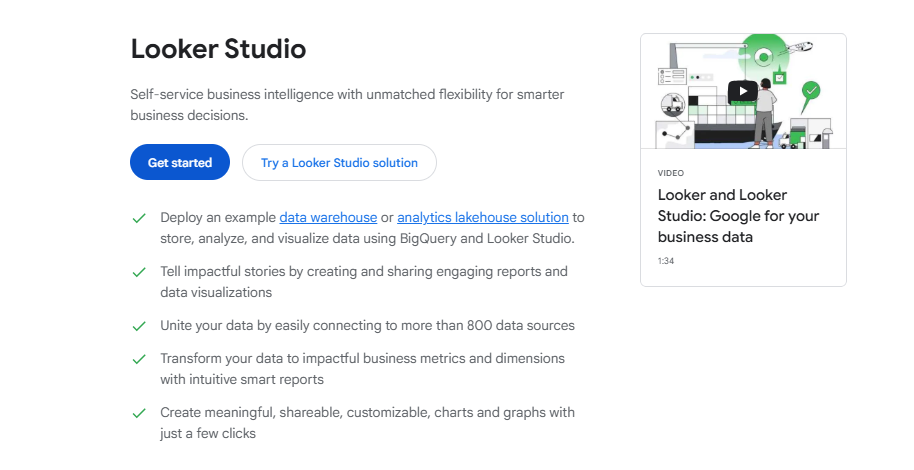
The platform connects to over 800 data sources including BigQuery, Google Analytics, and various CRM systems. This makes it attractive for small to medium businesses that need professional reporting without licensing fees.
Key Features
- 800+ Data Connectors: Direct integration with popular data sources and marketing tools
- Real-Time Collaboration: Multiple team members can edit reports simultaneously
- Customizable Templates: Pre-built dashboards for common use cases
- BigQuery Integration: Native connection to Google’s data warehouses
Pricing
| Plan | Monthly cost | Features |
|---|---|---|
| Free | $0 | Unlimited reports, basic sharing |
| Pro | $9/user | Team workspaces, enhanced administration |
Where Looker Studio Shines
- Cost-Effective: Free tier provides significant value for small teams
- Google Ecosystem: Seamless integration with Google Workspace and cloud services
- Quick Implementation: Create professional visualizations in minutes
Where Looker Studio Falls Short
- Performance Issues: Large datasets cause significant slowdowns
- Limited Customization: Basic options compared to enterprise BI tools
- Schema Sensitivity: Reports break when underlying data sources change
Customer Reviews
“Google Cloud could benefit from enhanced compatibility with legacy systems & non-Google applications, particularly by simplifying the process of custom configurations.” – Verified G2 user
Who Looker Studio Is Best For
- Small Marketing Teams: Need basic data visualization for campaign performance
- Google Workspace Users: Already invested in Google’s ecosystem

Luzmo
Luzmo specializes in embedded analytics for SaaS companies, offering white-label dashboards that integrate into existing applications. The platform focuses on speed of implementation, allowing product teams to add analytics features quickly.
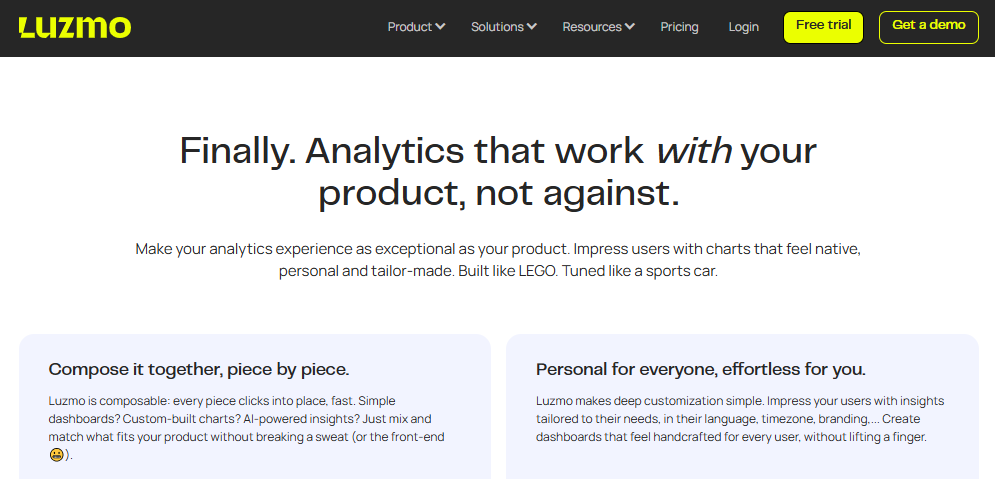
With multi-tenancy support built-in, Luzmo handles the complex data management requirements that often complicate embedded analytics implementations.
Key Features
- White-Label Customization: Complete brand control over embedded dashboards
- Multi-Tenant Architecture: Automatic data segregation and access controls
- Drag-Drop Builder: No-code interface for creating custom analytics experiences
- API-First Design: Robust APIs for data integration and development
Pricing
| Plan | Monthly cost | Features |
|---|---|---|
| Basic | $995 | 1 dashboard, 100 end users |
| Professional | $2,050 | 5 dashboards, 500 end users |
| Elite | $3,100 | 30 dashboards, 1000 end users |
Where Luzmo Shines
- Rapid Deployment: Get embedded analytics live within weeks
- Excellent Support: Dedicated customer success team helps with implementation
- Security Focus: Enterprise-grade security with data encryption and compliance
Where Luzmo Falls Short
- Limited Advanced Features: Complex predictive analytics aren’t available
- Navigation Complexity: Managing multiple dashboards becomes cumbersome
- Formula Limitations: Advanced calculations require custom development
Customer Reviews
“One of the drawbacks of the simplicity of use is that we cannot customize the dashboards as much as possible, but the support team helps us with workarounds or adding our requests to their roadmaps.” – Verified G2 user
Who Luzmo Is Best For
- SaaS Product Teams: Need embedded analytics without heavy development resources
- Security-Conscious Organizations: Prioritize data governance and compliance
Omni
Omni bridges the gap between technical and non-technical users by offering multiple ways to interact with data. The platform supports everything from point-and-click interfaces to SQL queries, making it suitable for diverse team needs.
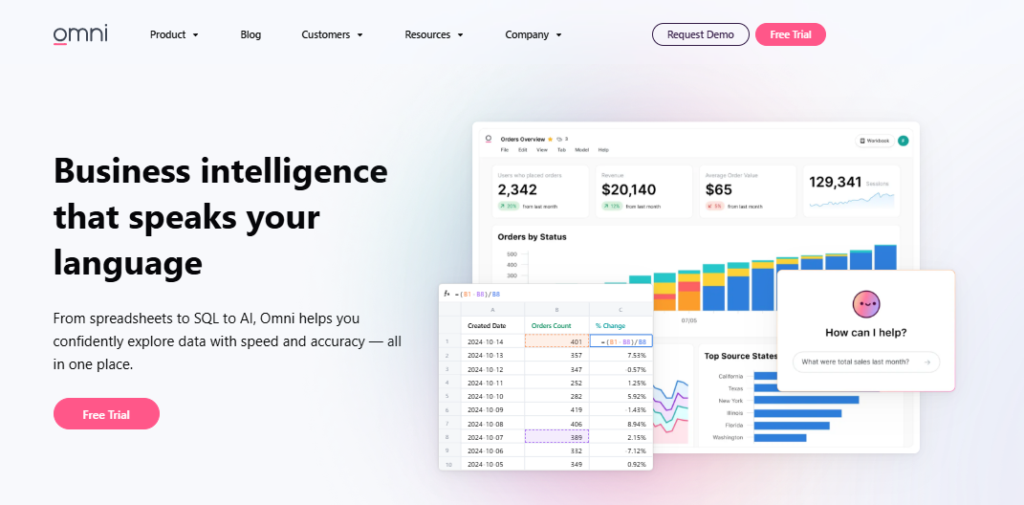
Built for modern data warehouses like Snowflake and BigQuery, Omni includes native dbt integration and a semantic layer for consistent data governance.
Key Features
- Flexible Interface: Choose between visual builders, SQL editor, or natural language
- Semantic Layer: Centralized data modeling ensures consistent definitions
- dbt Integration: Native support for data transformation workflows
- Embedded Options: Analytics capabilities for customer-facing applications
Pricing
Omni offers custom pricing based on team size and data sources. Contact their sales team for personalized quotes.
Where Omni Shines
- Self-Service Analytics: Empowers entire organization while maintaining governance
- Modern Architecture: Built specifically for cloud data warehouses
- Exceptional Support: Real-time assistance via Slack integration
Where Omni Falls Short
- Learning Curve: Advanced features require significant training investment
- Performance Issues: Occasional delays with complex queries
- Limited Visualizations: Some chart types are missing compared to mature tools
Customer Reviews
“The learning curve for advanced features can be steep – while basic usage is intuitive, mastering the modeling layer and more complex joins takes time.” – Verified G2 user
Who Omni Is Best For
- Mid-Market Companies: Need a self-service analytics platform with centralized governance
- Technical Teams: Require SQL interface alongside visual analytics
Tableau
Tableau remains a powerhouse in data visualization, offering extensive connectivity and sophisticated chart types. As part of Salesforce, it provides deep integration with CRM systems and marketing platforms.
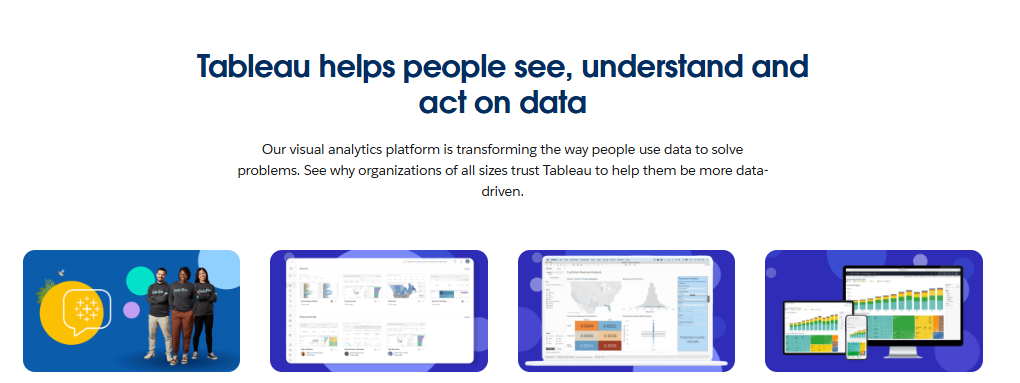
The platform excels at creating complex, interactive visualizations that help users discover insights through exploration rather than predefined reports.
Key Features
- Advanced Visualizations: Comprehensive options including geospatial analytics
- Data Source Connectivity: Connect to virtually any data source
- Collaboration Tools: Real-time sharing and commenting on dashboards
- AI Features: Automated insights that identify trends and anomalies
Pricing
| Plan | Monthly cost | Features |
|---|---|---|
| Viewer | $35 | View and interact with dashboards |
| Explorer | $70 | Edit existing content, limited creation |
| Creator | $115 | Full authoring, data modeling, administration |
Where Tableau Shines
- Visualization Power: Create stunning, interactive visualizations with minimal coding
- Large Dataset Performance: Handles enterprise-scale analytics effectively
- Community Support: Extensive user community and training resources
Where Tableau Falls Short
- Steep Learning Curve: Complex interface requires significant training
- High Costs: Expensive licensing for smaller teams
- Performance Limitations: Very large datasets can cause issues
Customer Reviews
“Some features are hard for new users to understand at first, especially advanced calculations. Dashboards can get slow if you’re working with large datasets, so we sometimes have to optimize them or use extracts. Also, Tableau can be expensive if you need a lot of people to have access.” – Verified G2 user
Who Tableau Is Best For
- Enterprise Analytics Teams: Need sophisticated data visualization capabilities
- Large Organizations: Can justify higher licensing costs
Reasons to Consider an Alternative to Domo
Between flat-table constraints, limited data modeling, and a lack of reusable workflows, engineering teams using Domo are constantly patching workarounds.
If your dev team is drowning in dashboard maintenance, an alternative built for SaaS could be the upgrade you need.
Unpredictable Pricing Creates Budget Chaos
Domo’s consumption-based pricing model creates uncertainty that makes budget planning nearly impossible. Users report confusion over token consumption, with costs ranging from $20,000 to $50,000 annually for mid-sized companies.
When your BI platform pricing depends on mysterious tokens that fluctuate based on data sources and query complexity, CFOs can’t plan effectively.
Qrvey’s transparent pricing eliminates these concerns with predictable costs based on actual usage patterns.
Limited Embedded Analytics Capabilities
Domo’s embedded analytics feel like afterthoughts rather than core features. The platform was designed for internal business intelligence, not customer-facing data visualization.
Compare this with Qrvey’s embedded analytics platform that provides white-label solutions for brand consistency.
When you embed Domo dashboards into your SaaS application, users immediately recognize it as third-party software. This disconnect breaks your product’s user experience and reduces adoption rates.

Inflexible Data Architecture
Domo’s “all-in-one” approach sounds convenient until you need customization that doesn’t fit their structure. The platform forces everything into flat tables, making complex data modeling nearly impossible.
Your data warehouses contain sophisticated relationships that Domo’s simplified approach can’t handle. When you need to combine datasets or perform advanced transformations, you’re forced to work around platform limitations.
You’ll never have to deal with this with a platform that focuses specifically on embedded analytics for SaaS applications.
This specialization creates a cleaner, more intuitive experience that reduces development time significantly.
Lack of True Multi-Tenant Support
Each SaaS customer requires separate data governance and access controls like the kind Qrvey offers below:
But Domo’s architecture makes this complex and error-prone. Your engineering team spends time building workarounds for tenant isolation. These custom solutions are fragile and create ongoing maintenance overhead.
As Qrvey CEO Arman Eshraghi notes: “User expectations are going to be higher, not lower. The competitors are going to deliver faster, not slower.” A platform built for speed, scale, and security is the only way to stay ahead.
Upgrade from Domo with Qrvey’s Scalable Embedded Analytics Solution
Still weighing your Domo alternatives? If analytics requests are eating up your roadmap, Qrvey gives product teams a clean way out. Built for SaaS, Qrvey offers self-service dashboards, tenant-level controls, and a no-code builder so users create their own reports, not your dev team.
Unlike traditional BI platforms, Qrvey integrates natively into your UX. That means fewer support tickets, higher NPS scores, and faster product releases.
With Qrvey, your end users get self-service analytics, and you stop chasing requests, freeing your development team to focus on innovative core features.
Ready to shift gears? Schedule a personalized Qrvey demo and see how we compare to Domo.

David is the Chief Technology Officer at Qrvey, the leading provider of embedded analytics software for B2B SaaS companies. With extensive experience in software development and a passion for innovation, David plays a pivotal role in helping companies successfully transition from traditional reporting features to highly customizable analytics experiences that delight SaaS end-users.
Drawing from his deep technical expertise and industry insights, David leads Qrvey’s engineering team in developing cutting-edge analytics solutions that empower product teams to seamlessly integrate robust data visualizations and interactive dashboards into their applications. His commitment to staying ahead of the curve ensures that Qrvey’s platform continuously evolves to meet the ever-changing needs of the SaaS industry.
David shares his wealth of knowledge and best practices on topics related to embedded analytics, data visualization, and the technical considerations involved in building data-driven SaaS products.
Popular Posts

Why is Multi-Tenant Analytics So Hard?
BLOG
Creating performant, secure, and scalable multi-tenant analytics requires overcoming steep engineering challenges that stretch the limits of...

How We Define Embedded Analytics
BLOG
Embedded analytics comes in many forms, but at Qrvey we focus exclusively on embedded analytics for SaaS applications. Discover the differences here...

White Labeling Your Analytics for Success
BLOG
When using third party analytics software you want it to blend in seamlessly to your application. Learn more on how and why this is important for user experience.