


⚡Key Takeaways
- Qrvey is the best choice for SaaS companies needing white-label analytics that can be monetized and easily integrated into their products
- Mode offers the strongest solution for data teams who need SQL, Python and R support while still providing business-friendly dashboards
- Zoho Analytics delivers the most affordable option for small businesses seeking user-friendly analytics with AI assistance
- Tableau remains the leader for enterprises requiring sophisticated data visualization but comes with steeper pricing and learning curves, and struggles with multi-tenancy for SaaS.
| Tool | Best For | Standout Feature | Starting Price |
|---|---|---|---|
| Qrvey | SaaS companies needing customer-facing self-service analytics | Multi-tenant architecture for seamless embedding | Custom pricing |
| Mode | Technical teams needing code-friendly analytics | SQL/Python/R integration | $25/month per user |
| Spotfire | Data scientists solving complex problems | Advanced predictive modeling | Custom pricing |
| Zoho Analytics | Small businesses and Zoho ecosystem users | AI-powered assistant (Zia) | Free tier, $24/month |
| Google Analytics 360 | Enterprise marketing teams | Integration with Google marketing tools | $150,000/year |
| Tableau | Data-driven enterprises | Beautiful interactive visualizations | $35-$115/month |
In 2026, analytics tools that just make pretty charts are about as useful as a flashlight with dead batteries. Your customers need insights that drive action and revenue, not just another set of colorful graphs.
Yet, here’s the reality for most SaaS companies: your product team is buried under feature requests for better reporting while your engineering team quietly calculates how many sprints they’ll need to sacrifice to build what customers actually want. Meanwhile, your customers are still exporting data to Excel because they can’t get what they need from your current analytics.
After helping dozens of SaaS companies implement Looker alternatives in 2026, we’ve learned what works. In this guide, we’ll show you six proven alternatives evaluated through the lens of teams like yours: those who want better visualizations, seamless onboarding, and tools that fit the way you work.
This isn’t a list of the most popular tools but a curated guide to the best Looker Studio alternatives.
Alternative #1 Qrvey: Best for SaaS Companies Needing Embedded Analytics
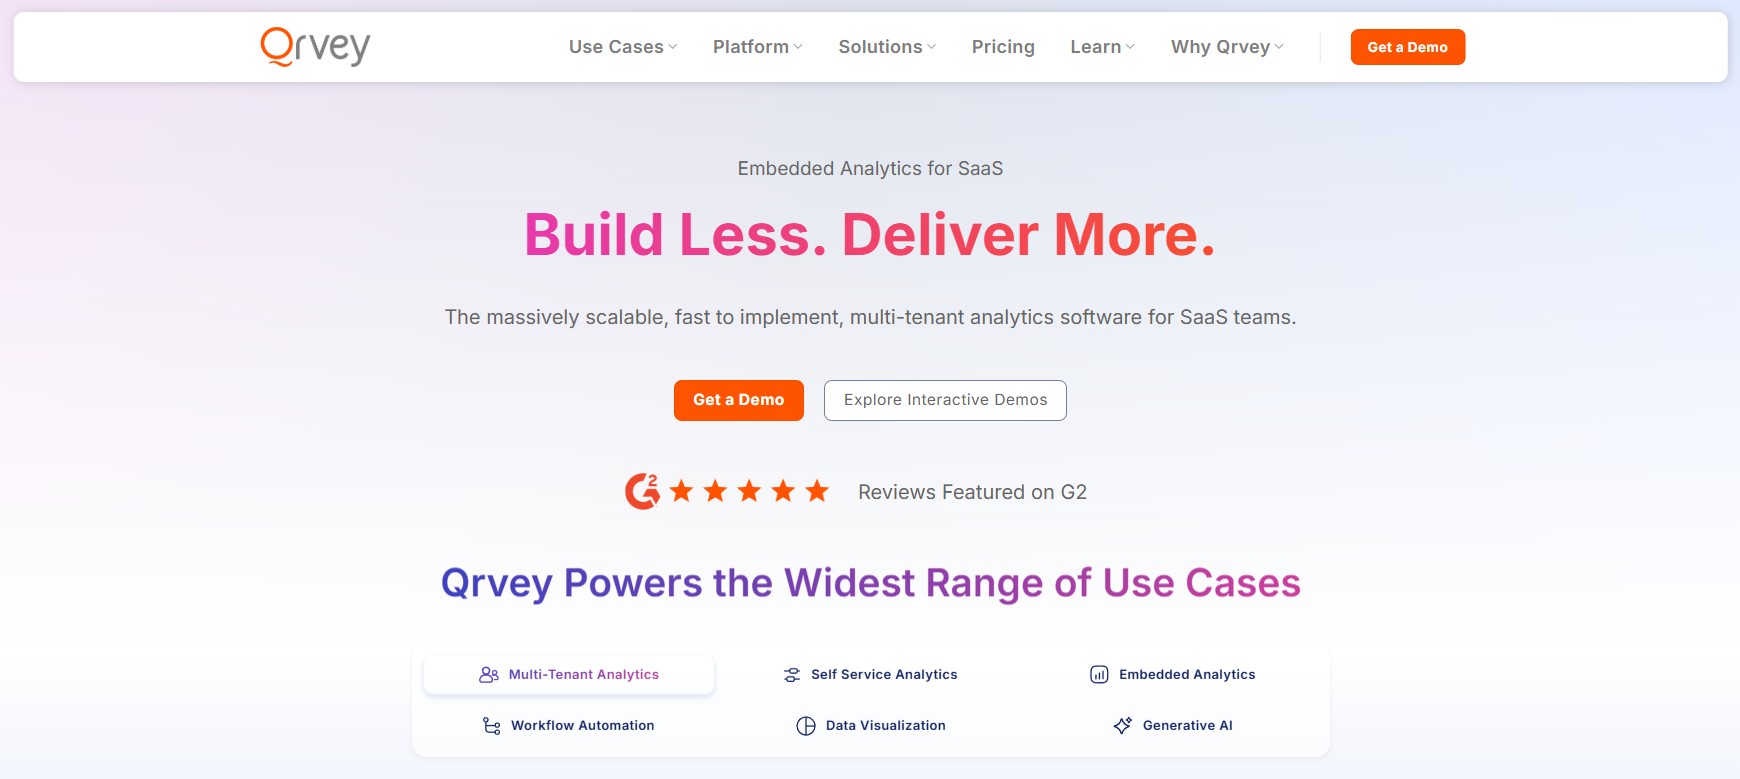
When your engineering team is already stretched thin and the last thing they need is to build complex analytics infrastructure from scratch, Qrvey offers a compelling solution. Unlike traditional BI tools retrofitted for embedding, Qrvey specializes in customer-facing analytics that truly integrate with your product.
What sets Qrvey apart is its architecture designed specifically for embedding. The platform was built from day one for multi-tenancy, providing each customer with personalized analytics while maintaining complete data separation – a feature that would take months to build in-house.
Key features
Here’s why product teams are increasingly choosing Qrvey to take analytics off their roadmap:
Multi-Tenant Data Architecture
Engineering teams consistently underestimate the complexity of building proper multi-tenant analytics. Qrvey’s data lake is built on Elasticsearch, delivering fast performance even with millions of records across thousands of tenants.
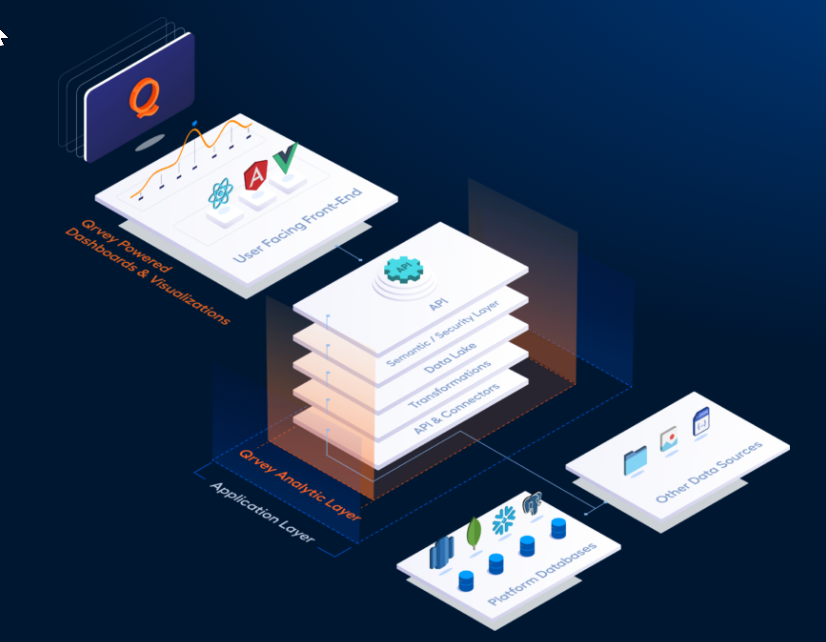
Each tenant’s data remains completely separate, eliminating the complex security models your team would otherwise need to build.
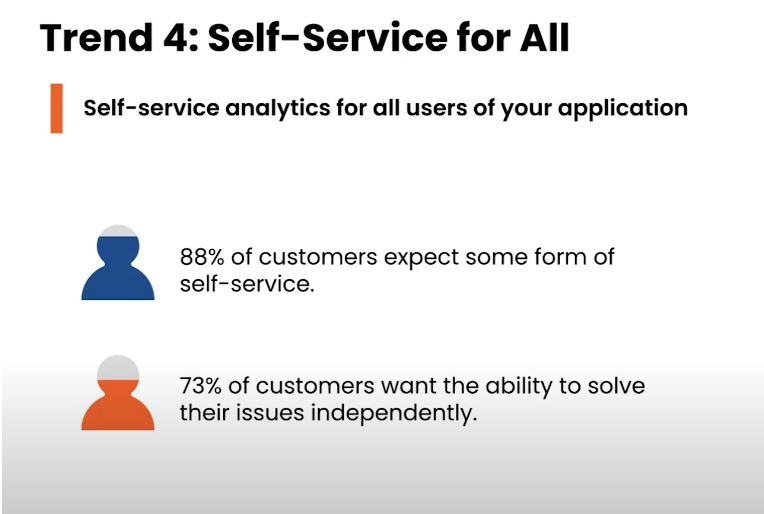
88% of customers expect self-service capabilities to independently solve their own problems and the platform delivers this without compromising security.
This means you don’t need to build complex security models from scratch since it’s already handled.
White-Label Embedding
The disconnect when an application suddenly shifts to an obviously bolted-on analytics tool creates a jarring user experience. Qrvey uses JavaScript widgets instead of iframes, so your analytics maintain your application’s look and feel.
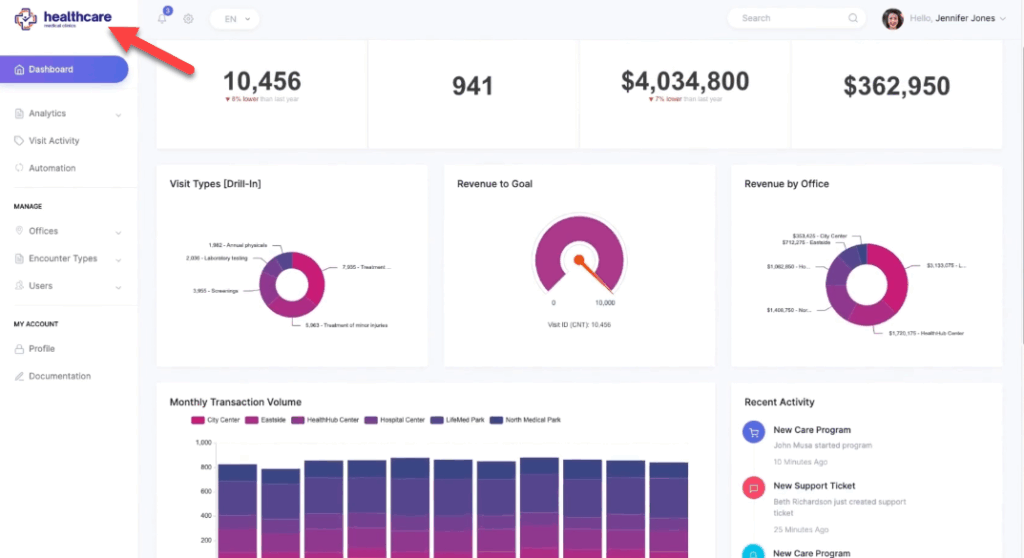
If customers are paying for a premium product, you cannot offer a janky iframe dashboard that looks like it’s from 2010.” Qrvey’s approach ensures your embedded analytics look like they were built in-house, preserving the seamless experience your customers expect.
Self-Service Analytics Dashboard Creation
Your customers don’t want to wait weeks for custom reports, they want answers now. Qrvey’s drag-and-drop interface makes it possible for actual humans without SQL expertise to create interactive dashboards that answer their specific questions.
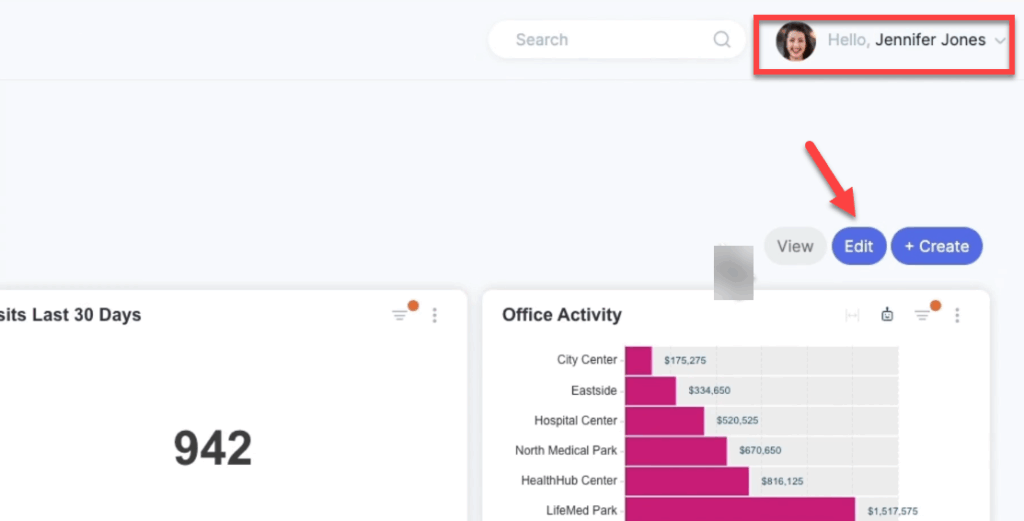
More than just being convenient, think about what this would do for your support team. Instead of drowning in report requests, they can empower customers to build exactly what they need.
Pricing
Qrvey offers custom pricing based on deployment size and feature requirements.
| Plan | Features | Price |
| All plans | Full stack multi-tenant analytics , Unlimited users, dashboards and environments | Custom pricing |
Where Qrvey shines
- Built for embedding: Unlike repurposed BI tools, Qrvey is designed specifically for embedding into SaaS applications, with native integration capabilities that make integration more natural.
- Multi-tenant from the start: The architecture separates customer data automatically, saving months of development work compared to building this yourself.
- Revenue generation: Qrvey’s platform is designed to help you monetize analytics as a premium feature, turning a cost center into a profit center.
“New features equal new add-on modules equal new revenue opportunities” – David Abramson, CTO at Qrvey
Where Qrvey falls short
- Not for internal BI: If you’re primarily looking for internal business analytics rather than customer-facing solutions, other tools might be more appropriate.
- Limited public templates: Being newer to the market means fewer community-created templates compared to established players.
- Learning curve for advanced features: While basic implementation is straightforward, mastering all capabilities requires investment in learning the platform.
Customer reviews
“The people of Qrvey are incredible”- AC, Software Administrator, Verified G2 user
“”Excellent platform for embedded, cloud-native analytics and automation on AWS” – Dara K, Analytics Program, Verified G2 user
Who Qrvey is best for
- SaaS product teams: Teams that need to reclaim their roadmap from endless analytics requests to focus on core product differentiation.
- Multi-tenant applications: Products serving multiple customers who each need their own secure data views.
- Revenue-focused teams: Companies looking to monetize analytics through tiered offerings and premium features.
“It’s a totally different audience… We’re talking about product people like yourselves. You own a product, you’re building product features. This is about giving data and analysis tools to the customers of your applications.”
Ready to transform your SaaS product with embedded analytics? Get a personalized demo of Qrvey today!
Alternative #2 Mode

For organizations where data teams and business users struggle to collaborate effectively, Mode creates a bridge between technical analytics and business-friendly insights. It provides an environment where data scientists can work with their preferred tools while still making insights accessible to the broader organization.
Key features
- SQL, Python, and R support: Mode lets data teams write queries and perform analyses in their preferred languages, making it powerful for advanced analytics.
- White-labeled embedding: Share reports externally with customized branding, though not as deeply integrated as purpose-built embedding solutions.
- Version control and collaboration: Teams can work together on reports with built-in version tracking to prevent overwriting each other’s work.
Pricing
| Plan | Features | Price |
| Studio | Interactive dashboards, SQL, Python, & R | Free |
| Pro | Advanced security, standard support | Custom pricing |
| Enterprise | Full platform access, premium support | Custom pricing |
Where Mode shines
- Technical flexibility: Data teams appreciate the freedom to switch between SQL, Python notebooks, and R without switching between multiple tools.
- Rapid iteration: Analysts can quickly update reports and immediately share changes, speeding up the insight-to-action cycle.
Where Mode falls short
- Customer-facing limitations: While Mode offers embedding, it wasn’t built from the ground up for multi-tenant white-labeling like tools compared in Qrvey vs Looker.
- Learning curve: Non-technical users may find the interface less intuitive than dedicated business user tools.
- Performance with large datasets: Some users report slowdowns when working with extremely large data volumes.
Customer reviews
“”Mode is the SQL kit you wish you always had”” – Product Manager, Computer & Network Security, Verified Capterra user
Who Mode is best for
- Data-driven organizations: Companies with dedicated analysts who need advanced tools but still want to share insights broadly.
- SQL-proficient teams: Groups comfortable with query languages who want to go beyond basic drag-and-drop interfaces.
Alternative #3 Spotfire
Spotfire delivers advanced visualizations and predictive analytics for organizations tackling complex data challenges. It’s particularly strong in industries like healthcare, energy, and manufacturing where detailed data analysis drives critical decisions.
Key features
- Deep statistical analysis: Built-in tools for advanced analytics including predictive modeling, making it powerful for specialized industry use.
- Data wrangling capabilities: Strong tools for cleaning and preparing data before analysis, reducing dependency on separate ETL processes.
- R and Python integration: Connect with popular data science languages for advanced modeling.
Pricing
| Plan | Features | Price |
| Free trial | Data visualization, advanced analytics, AI-driven insights, dashboarding | Custom pricing |
| Paid plan | Data visualization, advanced analytics, AI-driven insights, dashboarding | Custom pricing |
Where Spotfire shines
- Statistical depth: Few tools match Spotfire’s built-in statistical capabilities, making it ideal for research and complex analysis.
- Industry-specific templates: Pre-built solutions for industries like healthcare and energy save implementation time.
Where Spotfire falls short
- Accessibility for casual users: The interface can overwhelm non-technical users who need simpler solutions.
- Embedding complexity: Not designed primarily for customer-facing analytics unlike Qrvey’s purpose-built embedding.
Customer reviews
“It is easy to use and very good integration with Data Science Tools. It provides complete control over all the components.” – Amarjit K., Senior Manager, Business Supplies and Equipment, Verified G2 user
Who Spotfire is best for
- Data scientists and analysts: Technical users who need advanced statistical tools and don’t mind complexity.
- Specialized industries: Organizations in healthcare, energy, manufacturing, and scientific research with complex analytical needs.
Alternative #4 Zoho Analytics
Zoho Analytics offers an approachable business intelligence platform with AI assistance, making it particularly attractive for small to mid-sized businesses wary about breaking the bank.
Key features
- AI-powered assistant (Zia): Ask questions in natural language and get instant visualizations and insights.
- Extensive integrations: Connect with 500+ data sources including all Zoho products for seamless data flow.
- Collaborative features: Share and work together on reports with team members across the organization.
- Affordable pricing: Provides robust capabilities at lower price points than enterprise competitors.
Pricing
| Plan | Features | Price |
| Free | Basic analytics, 2 users | $0 |
| Basic | 2 users, 500K rows | $24/month |
| Standard | 5 users, 1M rows | $50/month |
| Premium | 15users, 5M rows | $125/month |
| Enterprise | 50+ users, custom limits | $495/month |
Where Zoho Analytics shines
- Ease of use: Non-technical users can quickly learn and create reports without extensive training.
- Cost effectiveness: Delivers solid analytics capabilities at significantly lower prices than enterprise solutions.
- Ecosystem integration: Works seamlessly with other Zoho products for businesses already in that ecosystem.
Where Zoho Analytics falls short
- Enterprise scale: May struggle with very large data volumes compared to platforms like Qrvey’s Elasticsearch-based data lake.
- Advanced embedding: While it offers some embedding capabilities, it lacks the deep multi-tenant architecture needed for serious SaaS integration.
- Customization depth: Offers fewer options for advanced customization than specialized visualization tools.
Customer reviews
“The ease of use of the product is great. Once data is imported, creating useful tables, reports, and dashboards can sometimes take a matter of minutes.” – Daniel T., Data Analyst, Verified Capterra user.
Who Zoho Analytics is best for
- Small to mid-sized businesses: Organizations with budget constraints but solid analytics needs.
- Zoho ecosystem users: Companies already using other Zoho products who want integrated reporting.
- Teams with limited technical resources: Groups without dedicated data scientists who still need powerful insights.
Alternative #5 Google Analytics 360

For marketing teams tracking customer interactions across digital touchpoints, Google Analytics 360 provides enterprise-grade marketing analytics that integrate seamlessly with Google’s marketing ecosystem.
Key features
- Seamless Google integration: Works perfectly with Google Ads, Search Console, and other Google marketing tools.
- Advanced attribution modeling: Understand which marketing efforts drive conversions through sophisticated attribution.
- Predictive metrics: Uses AI-powered insights to forecast user behavior and identify opportunities.
- Extensive data collection: Captures detailed user interactions beyond basic pageviews and sessions.
Pricing
| Plan | Features | Price |
| Enterprise | Complete platform access | Custom pricing |
| Small businesses | Site and app analytics | Free |
Where Google Analytics 360 shines
- Marketing insights: Provides unmatched visibility into marketing performance and customer behavior.
- Google ecosystem: Offers perfect integration with Google’s advertising and marketing tools.
- Data collection: Captures comprehensive user data with minimal configuration required.
Where Google Analytics 360 falls short
- Focus limitations: Primarily designed for marketing analytics rather than general business intelligence.
- Embedding options: Not built for embedding analytics into SaaS products unlike Qrvey’s purpose-built solution.
- Customization restrictions: Less flexible for specialized business metrics compared to dedicated BI platforms.
Customer reviews
“A great tool with huge amounts of data that can be useful for both personal and professional applications” – Stephen B., Marketing, Computer Software, Verified Capterra user.
Who Google Analytics 360 is best for
- Marketing-focused enterprises: Organizations heavily invested in digital marketing with substantial budgets.
- Google marketing users: Companies using Google’s advertising ecosystem who need deeper insights.
Alternative #6 Tableau
A popular Metabase alternative for visual data storytelling, Tableau’s renowned visualization capabilities turn complex data into compelling stories that resonate with stakeholders at all levels.
Key features
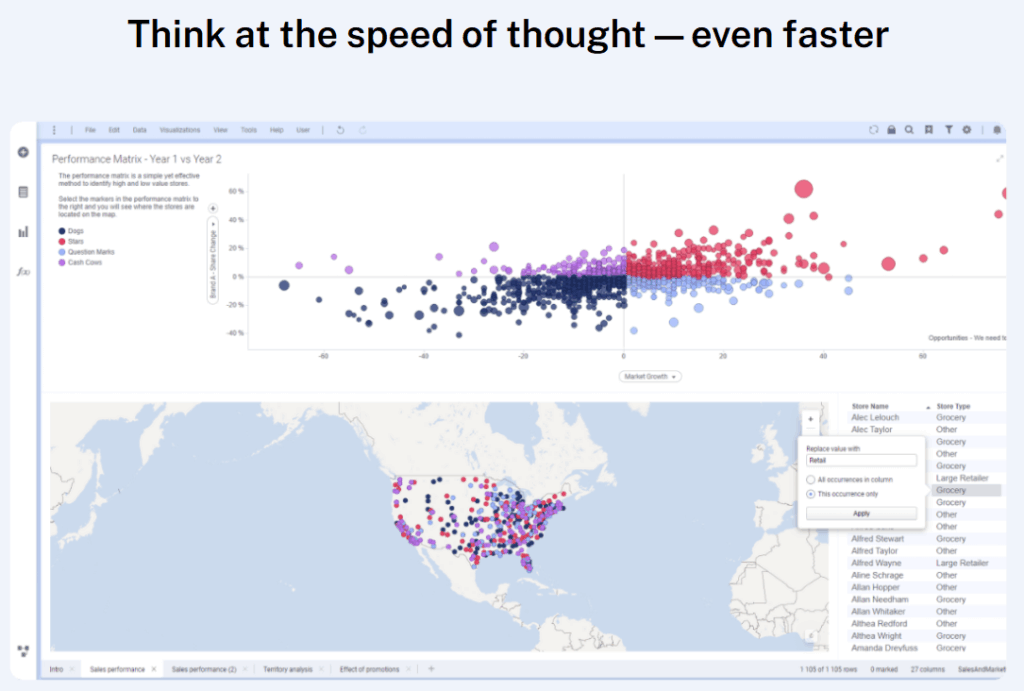
- Beautiful visualizations: Creates stunning, interactive charts that effectively communicate data stories.
- Broad data connectivity: Connects to virtually any data source through native connectors or APIs.
- Strong community: Extensive learning resources and template gallery from its large user base.
- Mobile-friendly: Dashboards work well across devices, including tablets and phones.
If you’re exploring Tableau but want to see how it stacks up against competing BI platforms, this breakdown of Tableau alternatives offers a helpful side-by-side perspective.
Pricing
| Plan | Features | Price |
| Viewer | View and interact with dashboards | $35/month per user |
| Explorer | Create and publish content | $70/month per user |
| Creator | Full authoring capabilities | $115/month per user |
Tableau offers several license types depending on the level of access you need. You can explore a detailed breakdown of costs in this Tableau pricing guide.
Where Tableau shines
- Visual impact: Creates the most aesthetically pleasing and intuitive visualizations in the industry.
- Data exploration: Allows users to dive deep into data relationships through interactive filtering.
- Enterprise scale: Handles large datasets and user bases effectively.
Where Tableau falls short
- Embedding complexity: While it offers embedding, it wasn’t built specifically for customer-facing analytics, which becomes more evident when comparing Qrvey vs Tableau and evaluating their approach to embedded use cases.
- Pricing structure: Can become expensive quickly as user counts grow due to per-user pricing model.
- Technical requirements: Often requires dedicated Tableau specialists to fully leverage its capabilities.
Customer reviews
“Tableau has the ability to handle large data sources. It has an easy interface which makes the developers life easy.” – Amar Y., Data Analyst, Apparel & Fashion, Verified G2 user.
Who Tableau is best for
One thing to note, Tableau works well for internal enterprise BI, but it is not designed for multi-tenant self-service embedded analytics. The following examples pertain to internal BI needs:
- Visual impact: Creates aesthetically pleasing and intuitive visualizations that make data accessible to non-technical stakeholders.
- Large enterprises: Organizations with substantial analytics budgets and dedicated data teams.
- Executive reporting: Companies needing to communicate complex insights to leadership through visual means.
Reasons to consider an alternative to Looker Studio
Pricing barriers
Looker’s enterprise pricing can shock many organizations, especially smaller companies and startups. Many teams find themselves priced out before they can even get started.
Qrvey offers flexible pricing that scales with your business, letting you start smaller and grow your analytics capabilities alongside your company without massive upfront costs.
Technical complexity
Looker Studio demands significant technical expertise with its proprietary LookML modeling language. This typically means either hiring specialized talent or investing in extensive training for your existing staff – both costly propositions in terms of time and budget.
Qrvey’s drag-and-drop interface makes creating dashboards accessible to business users while still offering advanced capabilities for technical teams when needed.
Limited embedding options
Embedded analytics usage has increased by nearly 50% with more customers now expecting self-service capabilities. Unfortunately, Looker’s embedding capabilities weren’t designed from the ground up for customer-facing analytics, creating friction with multi-tenancy, security, and seamless integration.
Qrvey was purpose-built for embedding with true multi-tenant architecture and white-labeling that makes your analytics look like a natural part of your product.
Slow time-to-value
Implementing Looker Studio typically takes months before you see any actual insights or value, creating frustration for teams under pressure to deliver results quickly. By the time you’ve finally got it configured, your requirements have already changed.
Qrvey’s specialized focus means faster implementation – many customers have dashboards embedded in their products within weeks rather than months.
Ready to see how much faster you could implement embedded analytics? Schedule a Qrvey demo today and see the difference.
Final Words On Looker Studio Alternatives…
Finding the right Looker alternative comes down to understanding your specific needs. For SaaS companies looking to add customer-facing analytics that don’t feel like an afterthought, Qrvey offers the fastest path to implementation with true multi-tenant architecture built specifically for embedding.
For internal business analytics, tools like Tableau and Mode provide powerful options depending on your technical requirements and visualization needs. Small businesses might find Zoho Analytics delivers solid capabilities.
Remember, you don’t need another tool that does everything poorly; just something that solves embedding problems exceptionally well.
Ready to try out Qrvey for embedded analytics? Start with a free personalized demo to see how quickly you could be pulling in more customers by offering reliable analytics.

Natan brings over 20 years of experience helping product teams deliver high-performing embedded analytics experiences to their customers. Prior to Qrvey, he led the Client Technical Services and Support organizations at Logi Analytics, where he guided companies through complex analytics integrations. Today, Natan partners closely with Qrvey customers to evolve their analytics roadmaps, identifying enhancements that unlock new value and drive revenue growth.
Popular Posts

Why is Multi-Tenant Analytics So Hard?
BLOG
Creating performant, secure, and scalable multi-tenant analytics requires overcoming steep engineering challenges that stretch the limits of...

How We Define Embedded Analytics
BLOG
Embedded analytics comes in many forms, but at Qrvey we focus exclusively on embedded analytics for SaaS applications. Discover the differences here...

White Labeling Your Analytics for Success
BLOG
When using third party analytics software you want it to blend in seamlessly to your application. Learn more on how and why this is important for user experience.