


⚡Key Takeaways
- Self-service dashboards empower your SaaS customers to create their own reports and visualizations without depending on your technical team, significantly improving customer satisfaction.
- Embedding analytics eliminates the need to build analytics features in-house, saving development time and resources while delivering professional-grade capabilities.
- In the build vs. buy debate, most SaaS companies save months of development time and ongoing maintenance by choosing specialized embedded analytics solutions like Qrvey
The average self-service dashboard is built with good intentions but poor usability. It doesn’t reduce requests, just redirects them. After a few frustrating clicks, users give up and your expensive tool becomes a dashboard graveyard.
The filters are confusing, the metrics are inconsistent, and every button raises more questions than it answers. Worse yet, no one’s accountable for fixing it. If self-service is supposed to empower teams, why does it feel like more work for everyone?
This guide breaks down the real reasons your dashboard isn’t working and what it takes to build one that finally does. We’ll walk you through everything you need to know about implementing self-service dashboards that your customers will love, while keeping your development team focused on your core product.
What Is a Self-Service Dashboard?
A self-service dashboard is an interactive analytics tool that empowers non-technical users to create, customize, and explore data visualizations without writing code or requiring assistance from data specialists. What is self service analytics? It refers to the capabilities that allow users to generate these insights independently, enabling them to access, interpret, and act on data without heavy reliance on IT teams or data analysts.
The customer who runs a mid-size retail chain can drag in sales data, filter by location, add a time comparison, and spot trends, all without submitting a single support ticket. Their marketing director can segment customers, track campaign performance, and pivot the data however they need.
For SaaS platforms, these capabilities need to be embedded directly into your application. No awkward redirects to third-party self-service BI tools. The analytics experience should feel like it was built specifically for your platform.
Why Do You Need an Embedded Self-Service Dashboard
A customer signs up for your SaaS platform, uses it for a few months, then starts asking questions your data visualization dashboard can’t answer. Soon they’re exporting raw data and creating their own reports in Excel. And just like that, a critical part of their workflow now happens outside your platform.
This pattern repeats until, at renewal time, they’re questioning the value of your solution. Why? Because the insights they need most come from Excel, not from you. Embedding self-service analytics directly into your platform can drastically improve customer satisfaction with embedded analytics, keeping them in your ecosystem and reducing the need for external data manipulation.
Here’s what happens when you embed proper self-service analytics:
- Your product team stops playing whack-a-mole with report requests and focuses on core features
- Support tickets for custom reports virtually disappear
- Customers who previously exported data now stay in your ecosystem
“Qrvey allowed Impexium to go to market quickly and get analytics into the hands of our customers.” – Dadou Jahanbani, CTO, Impexium
Don’t let reporting limitations drive customers away. See how embedded analytics works.
Features to Look for in a Self-Service Dashboard
Your customers don’t care about the technical architecture of your analytics platform. They want answers to their business questions without a degree in data science. For a truly impactful experience, consider embedded dashboards that keep all analytics within your platform. These dashboards ensure that users don’t have to jump between different tools and can access insights directly within their workflow, increasing adoption and engagement.
Intuitive Interface
What happens when a non-technical marketing manager sits down to create their first dashboard? If they can’t figure it out in 5 minutes, they won’t come back.
The interface needs to speak their language. Field names should reflect business terms, not database column names. The benefits of self service analytics include reducing the need for constant technical support, empowering users to create their own reports, and fostering a data-driven culture within organizations. Dragging metrics onto a canvas should produce sensible visualizations automatically. Creating filters should be as simple as clicking the values they want to include or exclude.
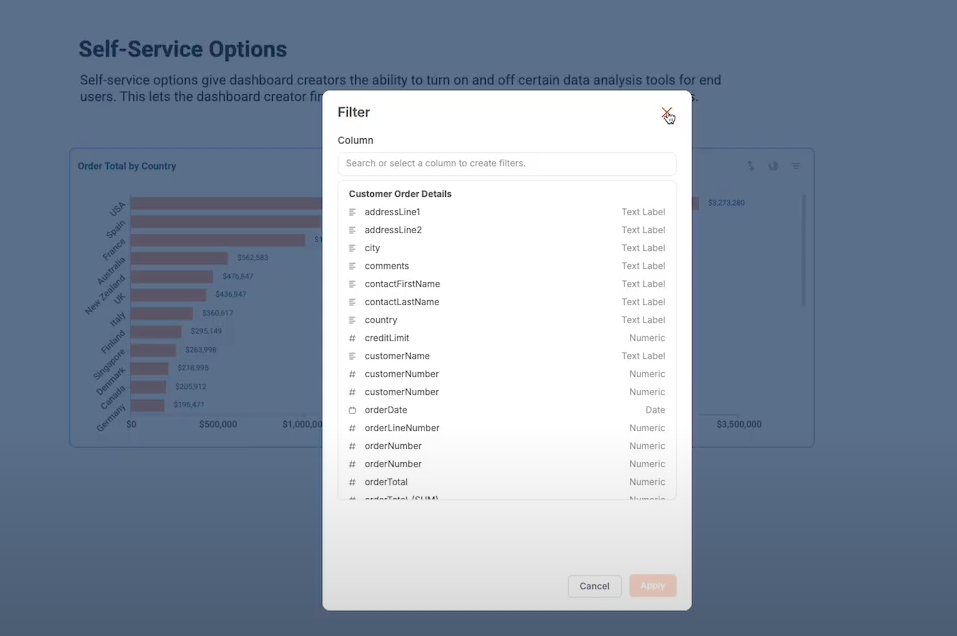
The best interfaces anticipate common analysis patterns and guide business users toward instant insights without assuming technical skills.
Customization and White-Labeling
Nobody wants their carefully designed product experience interrupted by a jarring transition to analytics. The reporting interface should feel like a natural extension of your application.
From colors and fonts to terminology and navigation patterns, the self-service analytics platform should adapt to your product, not the other way around. White-labeled embedded analytics preserve your brand experience while giving customers powerful tools.
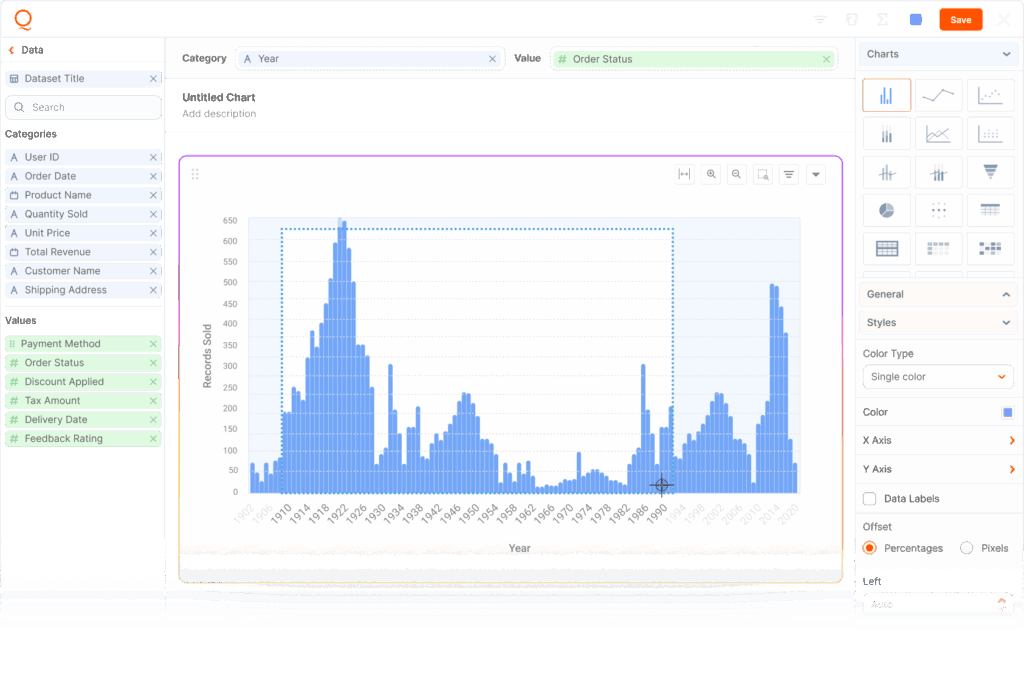
Interactive Visualizations
Static charts were impressive in 2010. In 2026, users expect to interact with their data, drilling down from summary to detail, filtering on the fly, and pivoting dimensions to explore different angles.
When your customer spots an unusual spike in a chart, they should be able to click it and instantly see what’s driving the anomaly. This kind of interactive visualization transforms passive reporting into active data exploration.
Business Benefits of Using a Self-Service Dashboard
Embedding self-service dashboards into your SaaS product drives measurable business outcomes for your company. Here’s how:
Increased Customer Retention
Your customers won’t leave you if they’re getting unique value they can’t easily replace. When they build custom dashboards in your platform, they create their own reasons to stay.
Each visualization they create and insights discovered based on your data build dependency on your platform. The analytics they’ve crafted become part of their workflow and institutional knowledge.
New Revenue Opportunities
The CFO keeps asking how to monetize all that customer data sitting in your system. The answer isn’t selling the data but selling insights. While data lake analytics pricing may seem affordable at first, the hidden costs-such as query fees, storage costs, and egress charges-can quickly add up, making the transition to self-service embedded analytics an even more attractive alternative.
Your product already captures valuable data. Giving customers a self-service analytics tool to extract insights from that data creates monetization opportunities that benefit both sides.
“All of these helps you deliver not just quickly but also new modules and new opportunities to potentially generate additional revenue on top of your existing initial offerings or MVP offerings” – David Abramson, CTO, Qrvey
Faster Decision-Making
When customers have to request reports from your team, they’re making decisions based on days-old or weeks-old data. By the time they get what they need, the opportunity may have passed.
Self-service dashboards shrink this insight-to-action timeframe from days to minutes. Your customers get answers when they need them, not when your team can deliver them.
Top Self-Service Dashboard Solutions
Some analytics platforms were built for data scientists and tweaked for embedding. Others were designed specifically for the needs of SaaS products.
Qrvey: Complete Embedded Analytics
Qrvey stands out in the SaaS analytics space for one simple reason: it was built from the ground up for multi-tenant SaaS applications.
Unlike generic BI tools adapted for embedding, Qrvey was purpose-built for multi-tenant SaaS architectures with features like:
- Complete white-labeling SaaS with JavaScript embedding (no iframes)
- Multi-tenant data lake powered by ElasticSearch for superior performance
- Inheritance-based security model that respects your existing permissions
- Built-in data connectors to integrate with any existing data source
How to create a Self-Service Dashboard in Qrvey
Step 1: Connect Your Data Source
Your customer data likely lives in application databases, data warehouses, maybe even third-party APIs. Qrvey’s data pipeline connects to these sources and consolidates them into an analytics-optimized data lake.
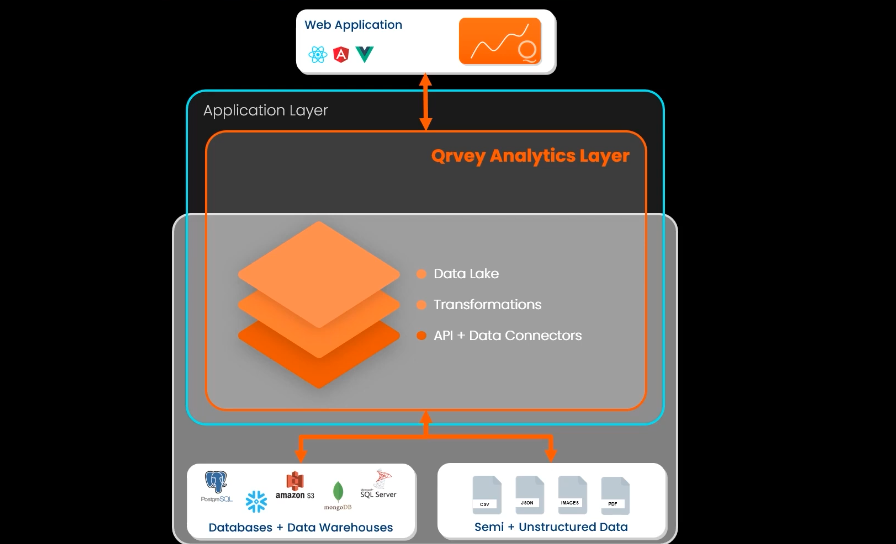
Step 2: Create Data Models
Define relationships and metrics once to ensure consistency across all dashboards. Qrvey’s semantic layer insulates users from complex data structures.
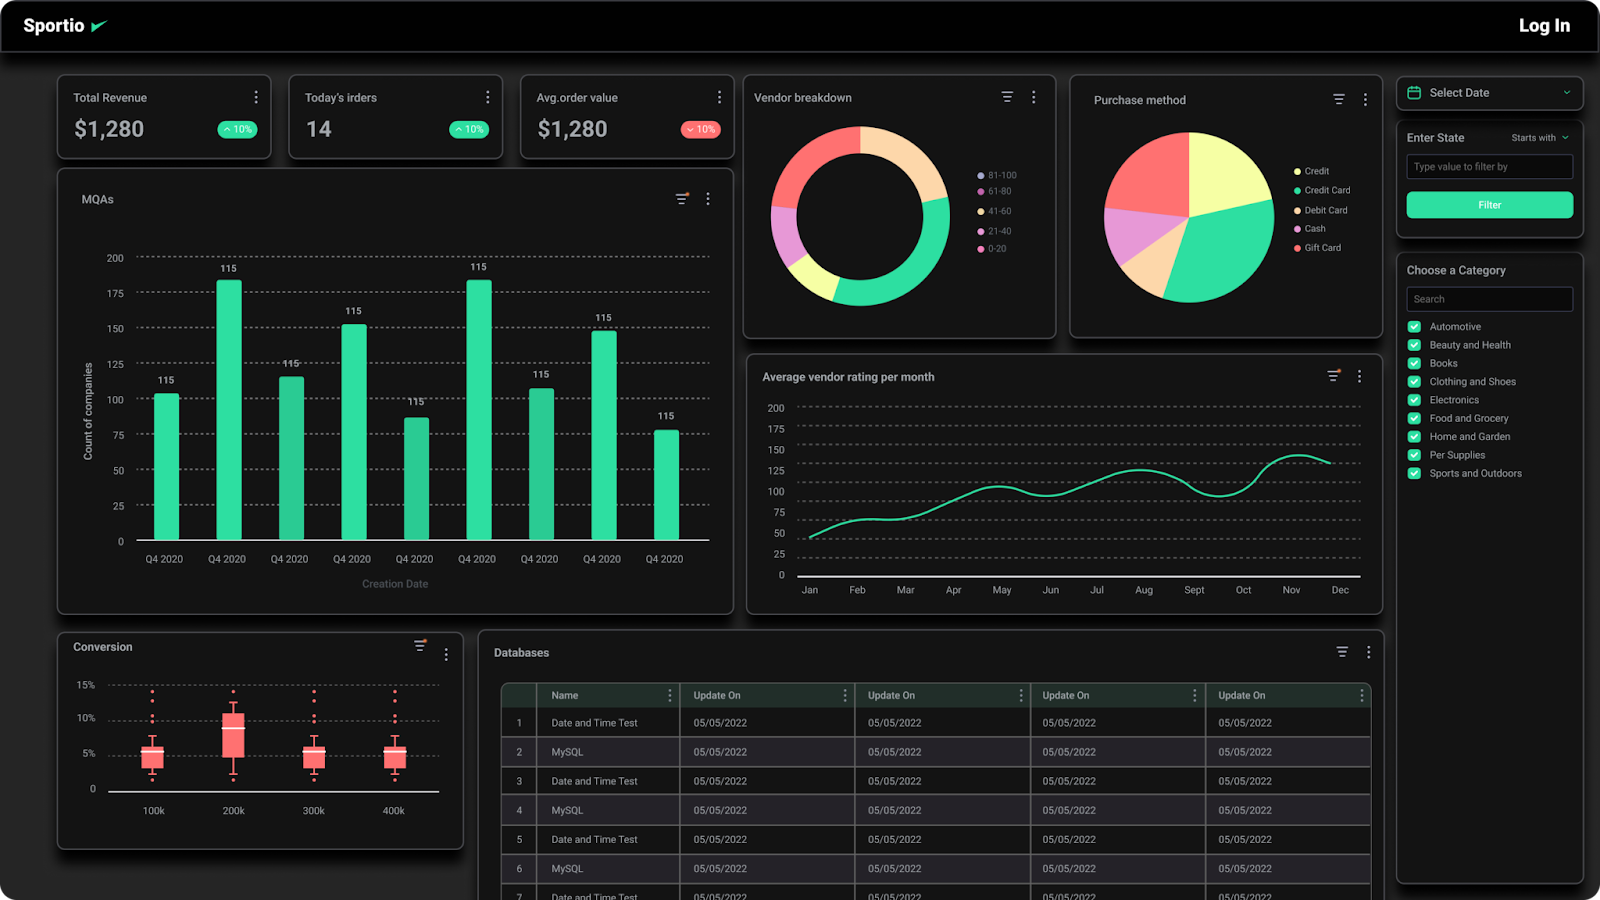
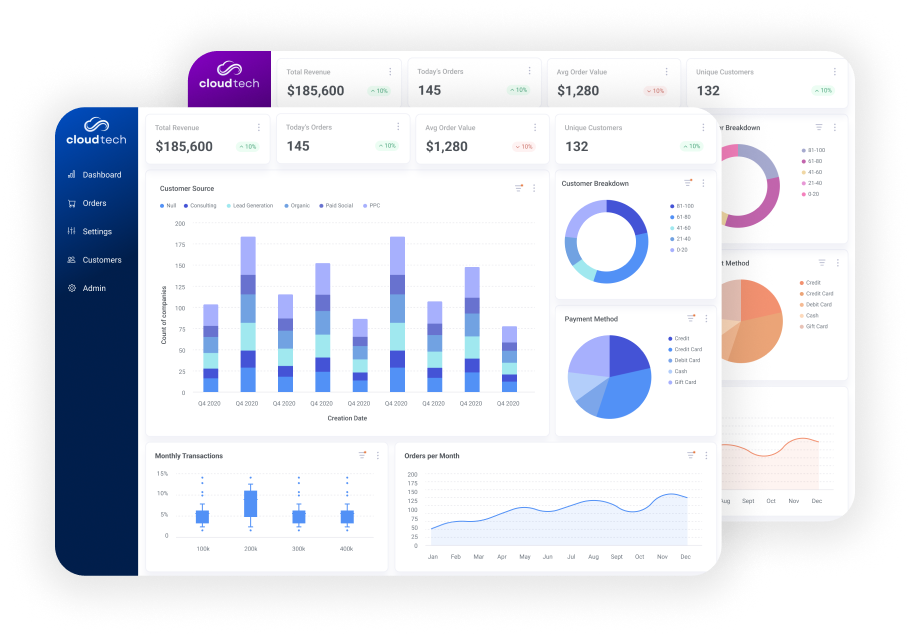
Step 3: Design Dashboard Templates
Create starter templates with your branding and common metrics to help customers get started quickly.
Step 4: Deploy to Your Customers
Embed dashboards into your application with simple JavaScript snippets, with full control over permissions and capabilities per customer.
Explore Qrvey’s embedded analytics platform: book a free demo today
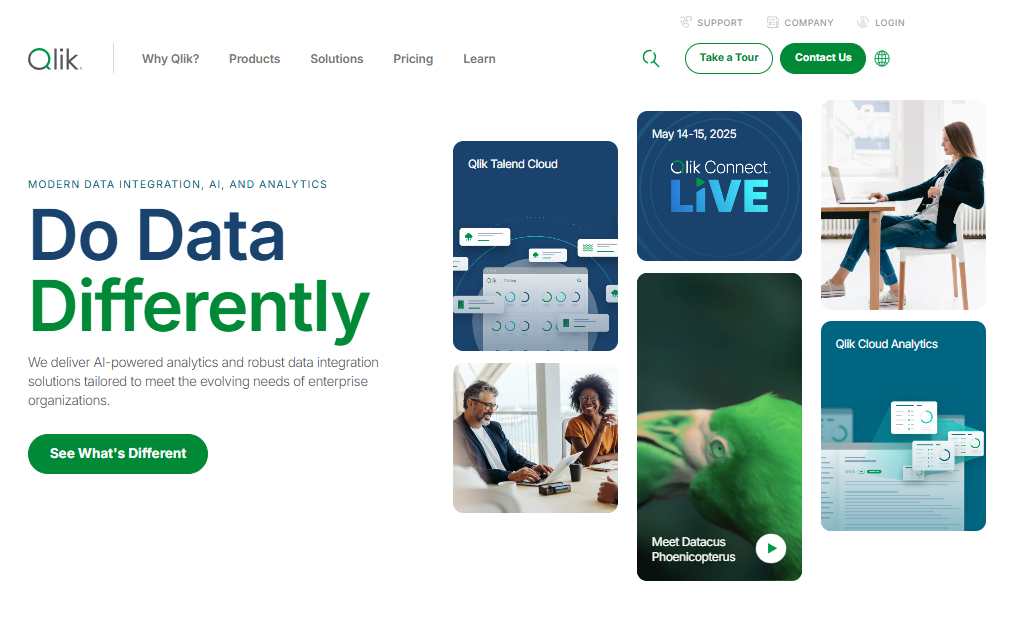
Qlik: Advanced Visualization Platform
Qlik Analytics has built a strong reputation for its associative data engine and advanced visualizations.
Their platform offers:
- Powerful data exploration through their associative model
- Strong AI-powered insight suggestions
While Qlik delivers solid visualization, it wasn’t architected specifically for embedded SaaS analytics. This can create challenges with white-labeling and integration into your application.
Power BI: Microsoft’s Analytics Solution
Microsoft’s Power BI has become a dominant player in the self-service business intelligence space, particularly for companies already invested in the Microsoft ecosystem. It offers:
- Excel-like formulas that feel familiar to finance and business teams
- Extensive connectivity to Microsoft and third-party data sources
Power BI works well as a standalone self-service BI tool but has limitations for true multi-tenant SaaS embedding. It lacks the architectural foundations needed for efficient multi-tenant deployments at scale.
Compare the best embedded analytics tools for your needs
Build vs. Buy: Why Many SaaS Companies Outsource Analytics
SaaS companies consistently underestimate both the initial build and ongoing maintenance costs. A seemingly simple dashboard project often expands to require:
- Front-end developers for the dashboard interface
- Backend developers for data processing and API layers
- DevOps engineers for scaling and performance
- Security specialists for proper multi-tenant isolation
- UX researchers to ensure usability for non-technical people
Meanwhile, specialized self-service analytics platforms have already invested years and millions of dollars in solving exactly the challenges you’re facing.
Use the ROI calculator and you’ll see the cost of building and maintaining an in-house solution typically exceeds that of a specialized platform
Pro tip: Buy the powerful analytics foundation from specialists, then focus your development efforts on the unique analytical features that differentiate your specific industry solution.
Learn why leading SaaS companies don’t build multi-tenant analytics
Take Your SaaS Product to the Next Level with Qrvey
Your product already captures valuable data. The question is whether that data becomes a liability (through exports and feature requests) or an asset (through embedded insights). The SaaS companies that thrive in 2026 won’t just offer better features. They’ll offer better insights that make their customers more efficient.
Qrvey was built specifically for SaaS companies who want to embed analytics without the massive engineering investment of building it themselves.
Schedule a free demo to see how embedded analytics improves customer satisfaction

Natan brings over 20 years of experience helping product teams deliver high-performing embedded analytics experiences to their customers. Prior to Qrvey, he led the Client Technical Services and Support organizations at Logi Analytics, where he guided companies through complex analytics integrations. Today, Natan partners closely with Qrvey customers to evolve their analytics roadmaps, identifying enhancements that unlock new value and drive revenue growth.
Popular Posts

Why is Multi-Tenant Analytics So Hard?
BLOG
Creating performant, secure, and scalable multi-tenant analytics requires overcoming steep engineering challenges that stretch the limits of...

How We Define Embedded Analytics
BLOG
Embedded analytics comes in many forms, but at Qrvey we focus exclusively on embedded analytics for SaaS applications. Discover the differences here...

White Labeling Your Analytics for Success
BLOG
When using third party analytics software you want it to blend in seamlessly to your application. Learn more on how and why this is important for user experience.