


⚡Key Takeaways
- Qrvey: Best for SaaS companies needing self-service analytics with multi-tenant support and a completely customized UI for their tenants
- Zoho Analytics: Perfect for small businesses wanting affordable BI tools for internal use with AI-powered insights and easy setup
- Tableau: Ideal for enterprises requiring advanced data visualization and robust governance features for their internal customers
- Mode: Best for technical teams who need code-friendly analytics with SQL, Python, and R support to deliver insight to internal analysts and business teams
Your support team is flooded with customer requests for “better dashboards” and “custom reports.” Meanwhile, the engineering team is drowning in creating tenant-specific reports, dashboards, and embedded analytics features while your core product development stalls.
Does this sound familiar? Embedded analytics software solves this by embedding powerful analytics directly into your app without the development hurdles and duct tape. No more choosing between customer demands and product roadmap priorities.
But many embedded analytics solutions look clunky when they’re integrated into your product. So while customers might get better reporting, it’s clearly not your product and that chips away at the overall product experience. It looks like you took a shortcut and bolted something onto your product. Not a good look, and your customers care.
Embedded reports and dashboards should seamlessly integrate into your existing product, and that includes how they look. The best white label analytics platforms allow you to completely customize the look and feel of your reporting capabilities so it looks like it was always there, rather than an afterthought.
We’ll show you four proven embedded analytics platforms that offer powerful data visualizations capabilities. Use this guide to determine which solution fits your needs, budget, and UI customization requirements. You’ll be on your way to deliver a white label reporting experience that your team is proud to offer.
| Name | Best For | Stand Out Feature | Price Starting Point |
| Qrvey | SaaS companies with multi-tenant needs | 100% white-labeled dashboards with CSS-level customization | Flat-rate pricing, unlimited licenses, dashboards, instances, data, and connections |
| Zoho Analytics | Small to mid-sized businesses | Embeddable charts with custom themes and branding | $24/month (per-user license cost not included) |
| Tableau | Enterprise organizations | Advanced white-label visualizations with governance | $75/month (per-user license cost not included) |
| Mode | Technical teams and data analysts | Custom-branded reports with flexible embedding | Tiered |
Qrvey: Best White Label Analytics Software
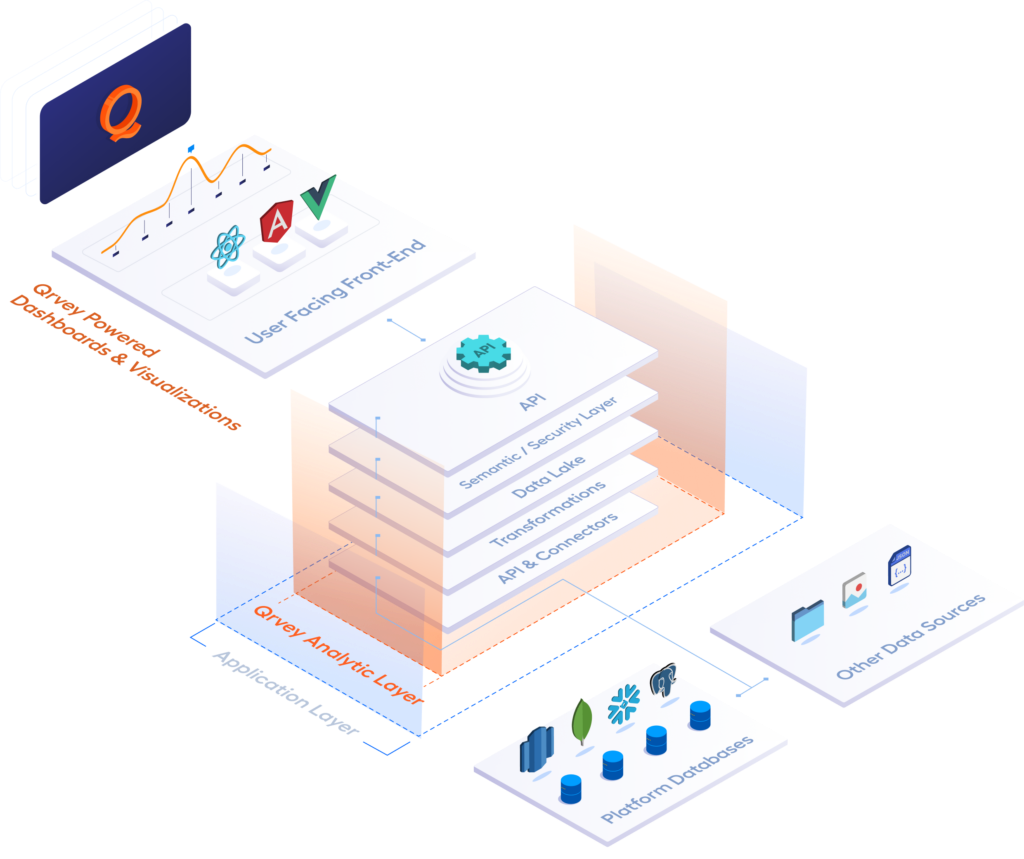
Qrvey is built specifically for SaaS companies who need to embed analytics into their applications. Unlike traditional BI tools that feel bolted-on and awkward, Qrvey gives you complete control over the user experience from day one.
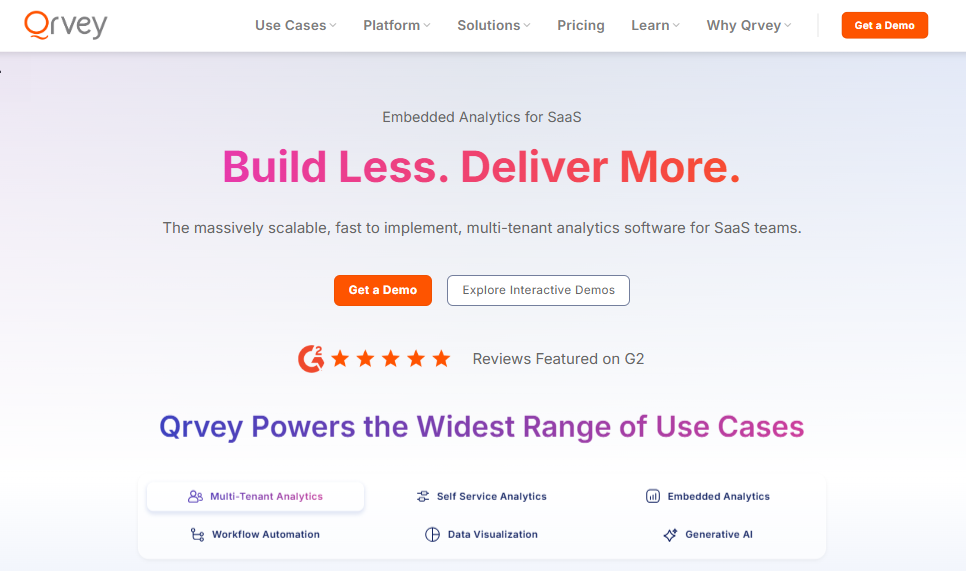
What truly sets Qrvey apart? It’s the only platform designed specifically for multi-tenant applications. Your customers get their own secure data space while you maintain one unified infrastructure that scales efficiently.
Key Features
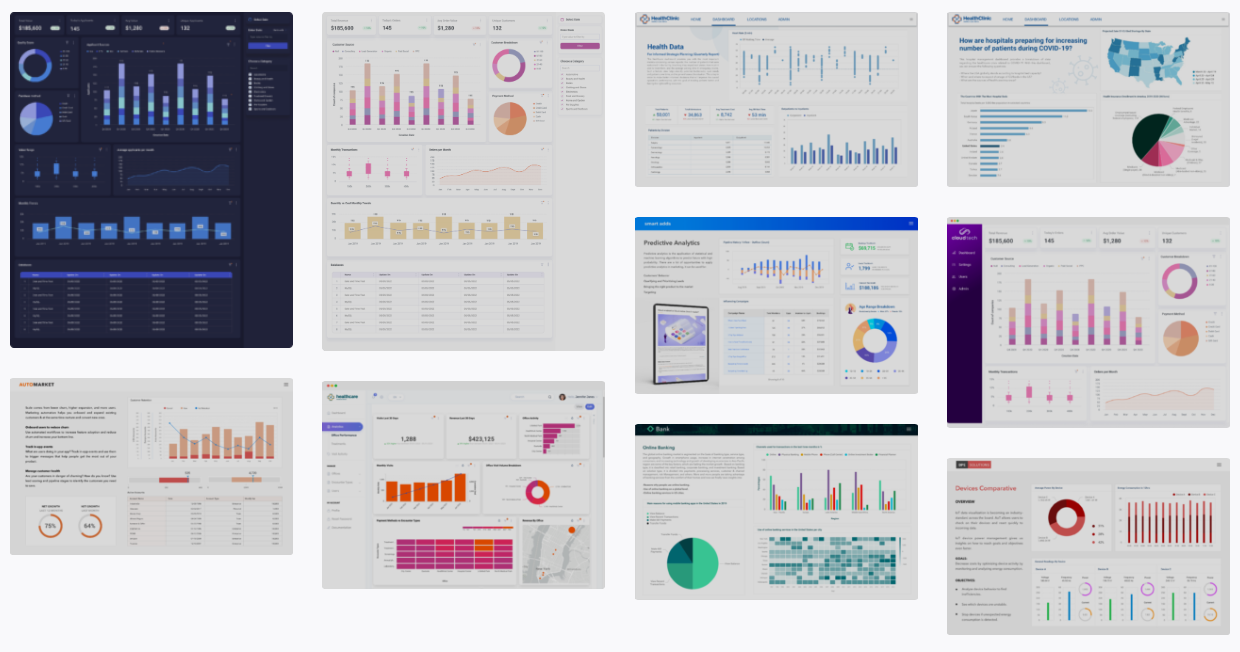
Your users don’t care how complex your backend is. They just want a great user experience. Qrvey makes it easy to embed beautiful, fully branded analytics dashboards directly into your app. These features below are what power that frictionless self-service experience.
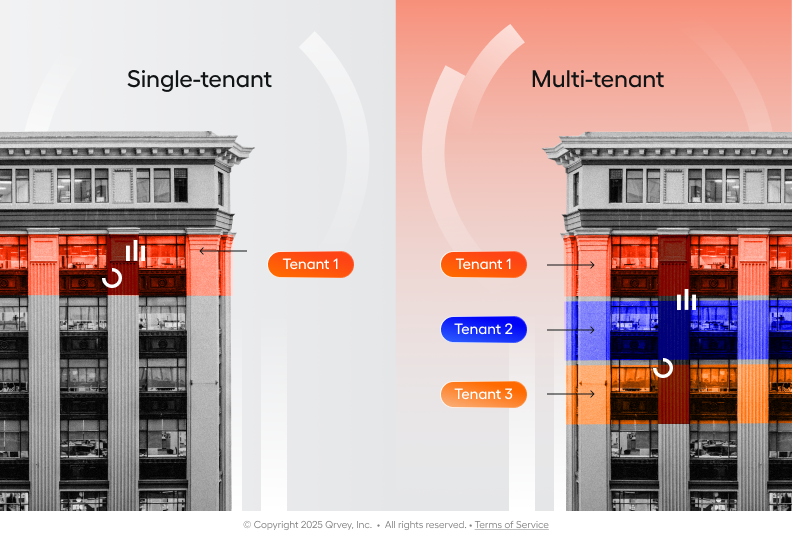
Multi-Tenant Data Architecture
Most platforms claim to support multi-tenancy, but they’re really just adding permission layers on top of single-tenant systems. Qrvey enables you to provide a data lake for each of your tenants. With data connectors and APIs for any data type, your customers are empowered to work with all their data however they’d like.
Each customer gets isolated data while sharing infrastructure costs and can build custom reports without seeing other tenants’ information.
No complex permission models to configure or security headaches to worry about.
100% Embeddable Components
This isn’t just about slapping your logo on someone else’s dashboard. You can customize user experience by choosing from various chart themes, CSS layouts, and interactivity options that make the analytics feel native to your application.
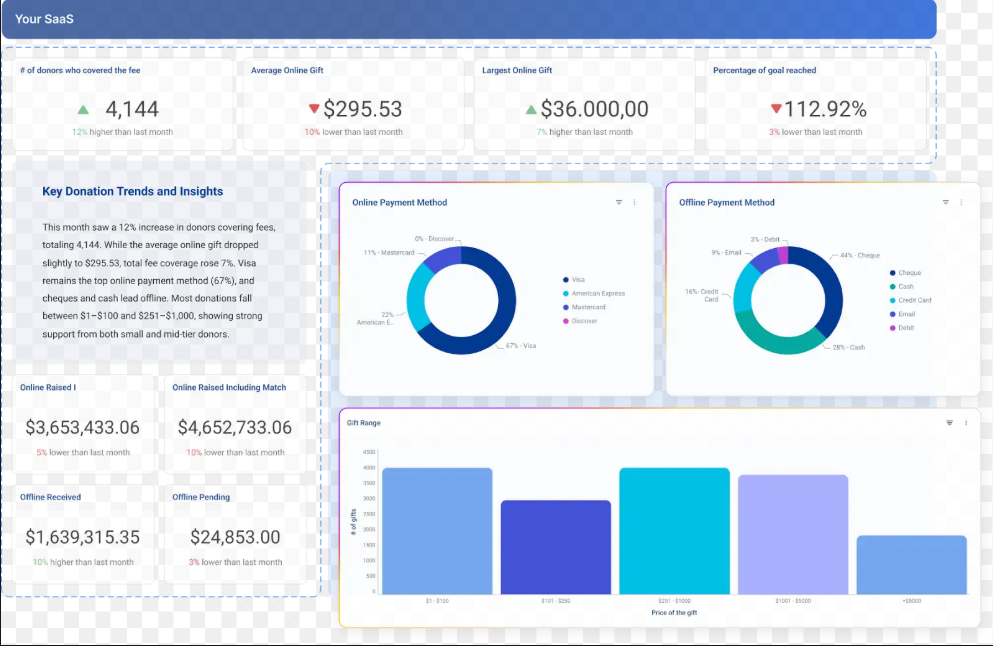
Everything embeds using clean JavaScript widgets, no clunky iframes that break your user experience. Your branding stays completely intact because users never see Qrvey’s interface or logo anywhere.
You get full control over every visual element with CSS-level customization that goes way beyond basic theming. Change layouts, colors, animations, interactions, and even micro-animations to match your app’s design system perfectly.
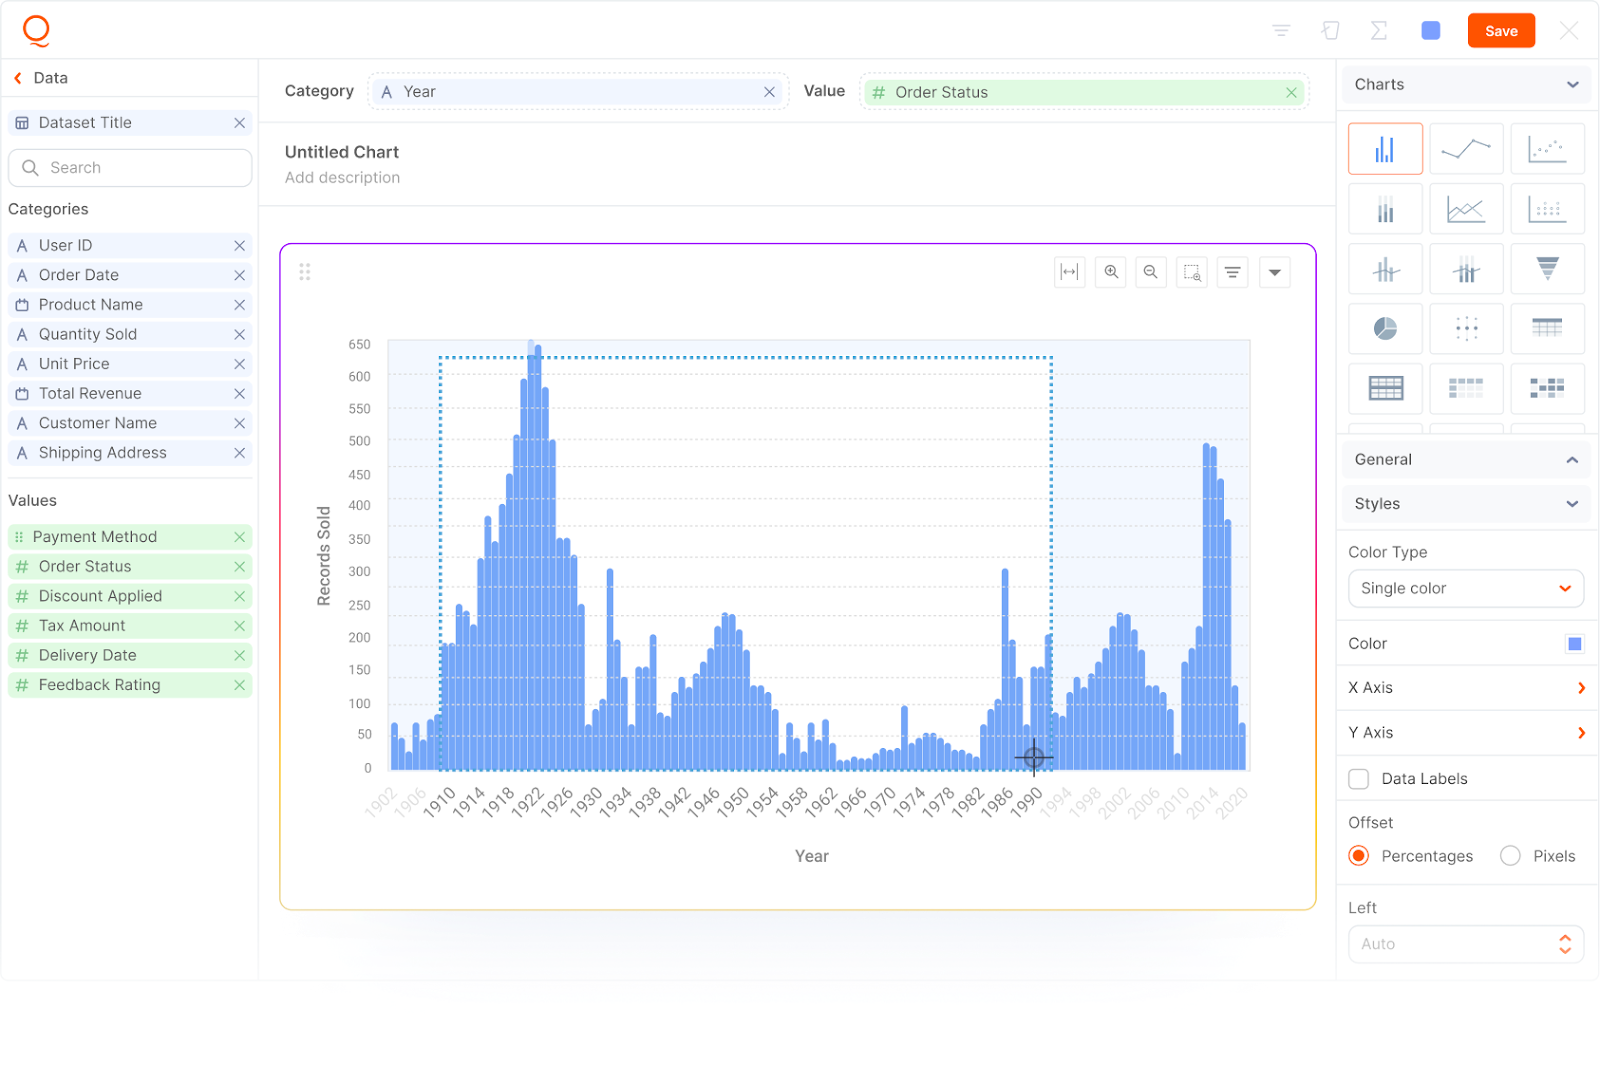
Self-Service Dashboard Builder
Your customers build their own dashboards without needing technical help or training sessions. The no-code drag-and-drop interface works exactly like modern design tools that business users already understand.
Power users can connect multiple data sources, perform complex data transformations, and build automated workflows. Everyone gets exactly the right level of functionality without overwhelming beginners or limiting experts.
The platform includes a no-code workflow automation builder that turns insights into actions. Customers can set up automatic alerts, trigger processes based on data thresholds, and create sophisticated business rules without involving your development team. This ability to move from insight directly to action is what sets Qrvey apart as more than just embedded BI, it functions like an agentic framework, enabling analytics that not only inform decisions but also execute them automatically.
Pricing
| Plan | Features Included | Price |
| Flat-rate pricing | unlimited users, dashboards, instances, data, and connections. | Quote-based |
Qrvey is the only embedded analytics vendor with flat-rate pricing and no hidden fees. In most cases other vendors’ pricing includes per-user licenses or fees, which really doesn’t work for SaaS companies who want to grow and scale their business. With Qrvey. you’re not penalized for success when your customer base grows.
Where Qrvey Shines
- Purpose-Built Multi-Tenancy: Designed for SaaS applications with complex tenant isolation requirements that traditional BI tools simply can’t handle effectively without expensive workarounds.
- Complete Visual Control: Full customization over branding and user interface elements (colors, styles, formatting), not just basic color scheme changes or logo swaps that most platforms offer.
- Developer-Friendly Architecture: Developers get the flexibility they need while maintaining strict security standards and optimal performance across different environments.
- Workflow Automation: Built-in automation capabilities turn data insights into automated business processes, reducing manual work for your customers while increasing platform stickiness.
- Seamless embeds: JavaScript enables embedding of reports, dashboards, and report * dashboard builders (no iframes!).
A Little Bit More On Why SaaS Companies Choose Qrvey…
- Fully White-Labeled Experience: Every chart, builder, and automation can be customized down to CSS and animation levels, ensuring analytics blend seamlessly with your brand.
- Unified Data Engine: Handle structured and semi-structured data natively; no external warehouse or costly integrations required.
- Cloud-Native and Secure: Deploy in AWS, Azure, and GCP (coming soon!) while maintaining total ownership of infrastructure, data privacy, and compliance boundaries.
- Built for SaaS Growth: Flat-rate pricing and tenant isolation scale effortlessly with your user base at a predictable cost.
Where Qrvey Falls Short
- Enterprise Focus: Built specifically for SaaS companies, so smaller businesses might find simpler tools more cost-effective for basic needs.
Customer Reviews
“Qrvey is one of the only tools out there that gives us the ability to embed a full suite of analytics into web apps. Qrvey’s embed capability goes beyond charts and dashboards, letting us integrate a full analytics authoring interface into apps.” – Dara K., Senior Business Consultant
“I like the flexibility of the page-building canvas, one can place as many charts as fits the need on a row or a page. Charts offer many configuration options to style them.” – Farnaz R., Co-Founder & Chief Technology Officer
Who Qrvey Is Best For
- SaaS Product Managers: Teams drowning in endless analytics feature requests who need to offer self-service capabilities to reduce support burden and speed up feature delivery.
- Engineering Leaders: Development teams who want to avoid building complex multi-tenant analytics systems in-house and focus their limited resources on core product capabilities instead.
- Enterprise SaaS Companies: Organizations serving large enterprise customers who demand sophisticated custom-branded reports and advanced data insights within their secure tenant environments.
Try a free Qrvey demo and see how embedded analytics can become your competitive advantage
Zoho Analytics: AI-Powered Business Intelligence for SMBs
Zoho Analytics brings AI to small and medium businesses through Zia, its conversational assistant. Ask questions about your data in plain English and get instant charts.
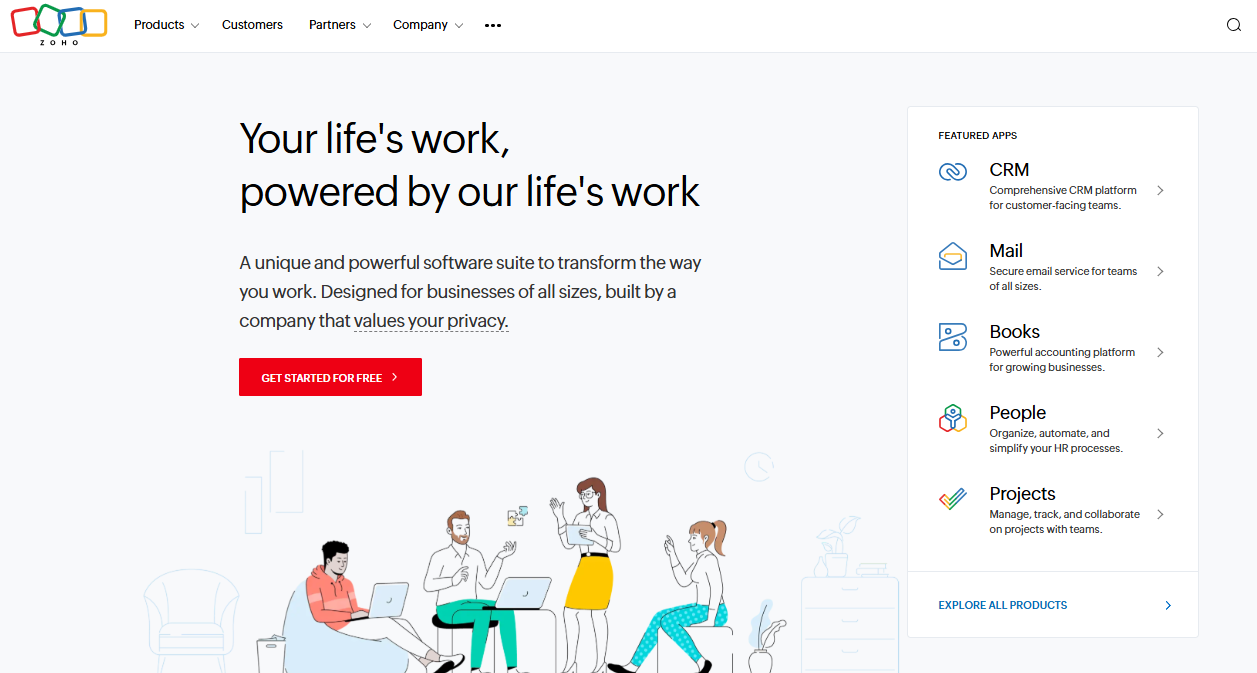
The platform connects to 500+ data sources and offers 50+ chart types. Perfect if you’re already using Zoho’s CRM or other business tools.
What makes Zoho Analytics appealing to smaller companies is its balance of powerful features with genuine ease of use. You don’t need a dedicated data team to get value from the platform.
Key Features
- AI Assistant: Zia answers data questions using natural language and suggests insights automatically.
- Easy Connections: Pre-built connectors to popular tools like Google Analytics, Salesforce, and major databases.
- Team Collaboration: Share dashboards and reports with colleagues for better decision-making.
Pricing
| Plan | Monthly Cost (Billed Annually) | Users Included | Rows Included |
| Free | $0 | 2 | 10,000 |
| Basic | $24 | 2 | 500,000 |
| Standard | $48 | 5 | 1,000,000 |
| Premium | $115 | 15 | 5,000,000 |
Where Zoho Analytics Shines
- Affordable: Low cost makes business intelligence accessible to smaller companies.
- Easy to Use: Intuitive interface requires minimal training for business users.
Where Zoho Analytics Falls Short
- Performance Issues: Slows down with large datasets or complex queries.
- Limited Features: Missing some enterprise capabilities found in Tableau or Power BI.
Customer Reviews
“Flexible and easy to configure at a reasonable cost” – verified G2 user
Who Zoho Analytics Is Best For
Small Business Owners: Companies needing affordable BI without enterprise complexity.
Tableau: Enterprise-Grade Data Visualization
Tableau dominates enterprise analytics with its VizQL engine and Einstein AI. The platform handles massive datasets and creates sophisticated visualizations.
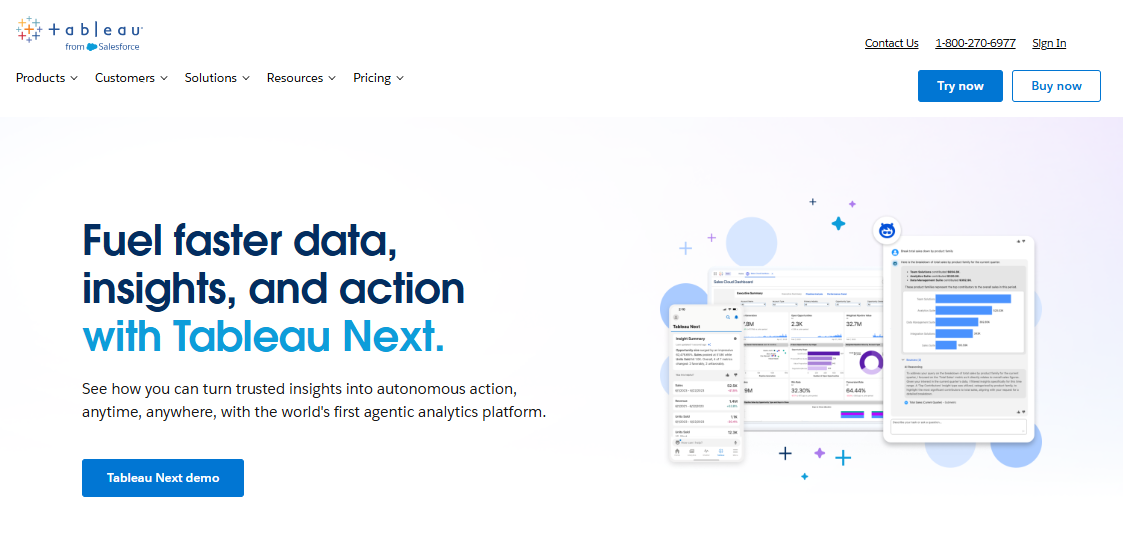
Salesforce ownership brings enterprise governance and compliance features. You get SOCII and ISO compliance built-in.
The platform’s strength lies in its ability to handle complexity without sacrificing usability for technical users. Data analysts and scientists can create sophisticated analyses while business users consume insights through intuitive dashboards, making it a very popular Metabase alternative as well.
Key Features
- Advanced Visualizations: Drag-and-drop interface creates complex charts without coding.
- AI Integration: Einstein provides automated insights and natural language querying.
- Enterprise Security: Robust controls meet strict regulatory requirements.
- Embedded Analytics: Tableau embedded analytics brings dashboards and visualizations directly into customer-facing apps.
Pricing
| Plan | Capabilities | Monthly Cost |
| Viewer | View and interact with dashboards | $15 |
| Explorer | Explore data & visualizations | $42 |
| Creator | Full platform access | $75 |
Tableau offers tiered plans designed for different user needs. For a deeper dive into hidden costs and plan comparisons, see our comprehensive Tableau Pricing guide.
Where Tableau Shines
- Visualization Power: Industry-leading chart capabilities with extensive customization.
- Enterprise Scale: Handles millions of users and complex data sources efficiently.
Where Tableau Falls Short
- Learning Curve: Advanced features require significant training investment.
- High Costs: Premium features become expensive for larger organizations.
For teams concerned about Tableau’s cost or learning curve, exploring leading Tableau alternatives can provide more flexible or budget-friendly options.
Customer Reviews
“Documentation is extensive for the software and the tableau community is strong, any doubts can be clarified easily.” – verified g2 user
Who Tableau Is Best For
Enterprise Data Teams: Large organizations with dedicated analysts who need powerful tools.
Mode: Code-Friendly Business Intelligence
Mode bridges the gap between highly technical data teams and business stakeholders who need accessible insights. Data analysts can write sophisticated SQL, Python, and R code while business users consume results through intuitive dashboards and reports.
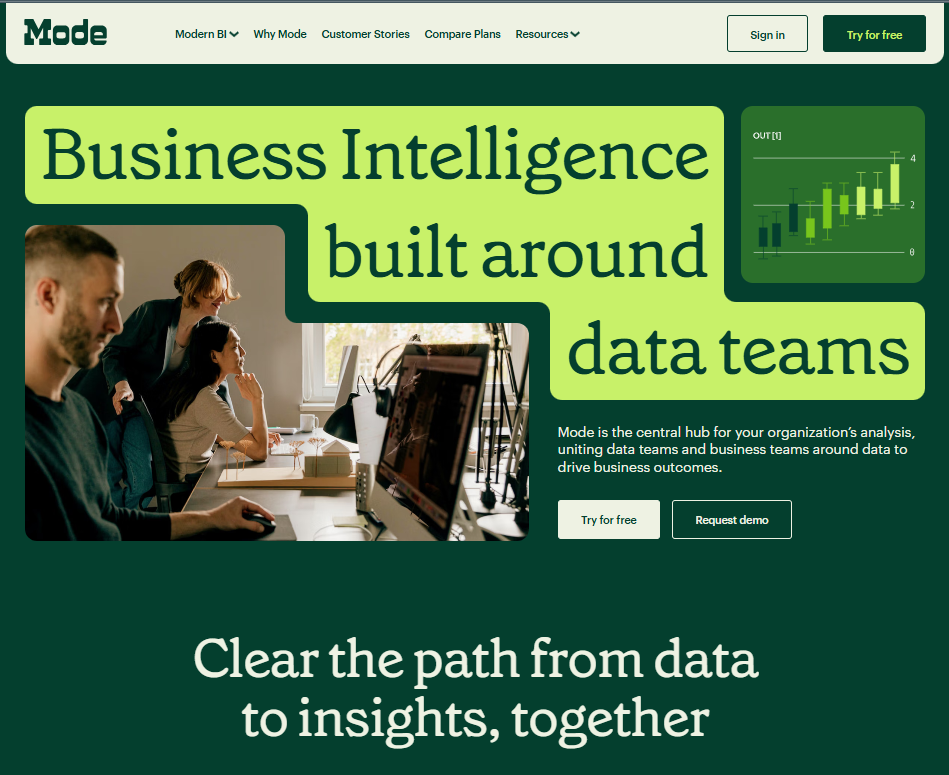
Perfect for organizations where data teams need coding flexibility but business users want self-service reporting.
Key Features
- Multi-Language Support: Native SQL, Python, and R for advanced analysis.
- Team Collaboration: Share code, queries, and insights in one platform.
- Embedding Options: White label SaaS dashboards for customer-facing applications.
Pricing
Custom quotes only.
Where Mode Shines
- Technical Flexibility: Unique mix of coding and business-friendly interfaces.
- Great Support: Excellent customer service and intuitive design.
Where Mode Falls Short
- Limited Alerts: Basic notification features compared to specialized tools.
- Organization Issues: Managing many reports becomes difficult over time.
Customer Reviews
“I love that MODE finds the info I need more quickly than other SQL-based programs, and gives it to me in an easier way to understand.” – verified g2 user
Who Mode Is Best For
Data-Driven Teams: Companies with technical staff who need advanced analysis plus business accessibility.
How to Choose White Label Analytics Software
Picking the wrong white label analytics software can mean months of wasted dev time, frustrated clients, or ballooning cloud bills. The stakes are high especially if you’re scaling fast. This section covers the key areas to focus on when comparing tool
Multi-Tenant Architecture
Each customer needs their own secure data environment while you maintain cost-effective shared infrastructure.
Traditional BI tools weren’t designed for multi-tenant scenarios. They typically rely on complex workarounds, custom permission layers, and expensive infrastructure duplication that creates both security risks and performance bottlenecks as you scale.
“Container technology, not servers, is the best option available to SaaS platforms to scale for growth while keeping costs in check,” explains industry expert David Abramson.
This architectural approach becomes crucial when your embedded analytics need to serve thousands of customers simultaneously.
Qrvey’s multi-tenant architecture eliminates these problems with purpose-built tenant isolation and automatic scaling.
Struggling with complex multi-tenant analytics requirements? See how Qrvey simplifies it without the architectural headaches.
Custom Branding Control
Complete visual identity control means customers never realize they’re using third-party software.
Basic theming options like changing colors and adding your logo aren’t sufficient for modern SaaS applications. You need CSS-level control over layouts, interactions, animations, and every visual element to maintain a cohesive brand experience.
Qrvey provides the deepest customization capabilities in the market. You can modify every user interface element, from button styles and chart animations to layout systems and interaction patterns.
Self-Service Capabilities
Your customers want to build their own dashboards and explore data independently, but they also need tools that don’t overwhelm them with complexity or require extensive training to use effectively.
Qrvey balances this with familiar drag-and-drop that business users understand, plus advanced features for power users. The benefits of self-service analytics become clear when customers can explore data independently, especially when supported by an agentic analytics platform that goes beyond insights to drive automated actions.
To better understand how this approach works in practice, you can explore Qrvey’s insights on agentic architecture, which explain how AI-driven systems enable analytics platforms to take intelligent, automated actions.
Most platforms make a fundamental trade-off: they either oversimplify the interface (limiting functionality for power users) or overcomplicate it (confusing non-technical users). Finding the right balance is important when connecting to your analytics database for user adoption and customer satisfaction.
Download our comprehensive guide to learn how successful SaaS companies add data visualization without creating support nightmares or user frustration
Making Strategic Product Decisions
Product decisions become increasingly complex as your SaaS platform grows. You’re constantly balancing existing customer demands with innovation opportunities while managing seemingly endless feature requests that can derail your core product roadmap.
What starts as “just add a few charts” quickly becomes multi-tenant data modeling, complex permission systems, performance optimization, and ongoing maintenance that consumes significant development resources.
The fundamental build versus buy decision comes down to ROI analysis and strategic resource allocation.
“The right way to think about build vs. buy is ROI. do the calculation: What’s the return if I build vs. buy? Many customers get stuck in the status quo when change could drive revenue, retention, and competitive advantage.” – Arman Eshraghi, CEO Qrvey
Consider these critical factors when making your decision:
- Time Pressure: Startups under 20 employees often choose speed over perfection. Getting analytics to market quickly beats building everything perfectly.
- Resource Limits: Building robust analytics requires specialized skills most teams lack. The key reasons not to build multi-tenant analytics include complexity that consistently exceeds initial estimates and ongoing maintenance burden that grows with your customer base.
- Customer Expectations: Modern users expect polished, integrated tools. “Good enough” no longer meets standards.
Curious about the real costs and ROI for your specific situation? Use our Build vs. Buy Calculator to get detailed cost comparisons and time-to-value analysis.
Data Integration and Connectivity
Pre-built data connectors can save months of development time, but they’re only valuable if they support your specific technology stack and data formats. Look for platforms that offer both extensive connector libraries and flexible API options for custom integrations.
Consider data transformation requirements as well. Can the platform handle complex ETL processes, or will you need additional tools in your data stack? Integration complexity often determines long-term success more than initial feature comparisons.
Get Started with Qrvey’s Embedded Analytics Platform
Customers are demanding sophisticated analytics capabilities, and your engineering team is struggling to balance core product development with endless dashboard requests. The best embedded analytics solutions are those that disappear into your application while providing powerful capabilities underneath.
Qrvey transforms these common challenges into competitive advantages. You get complete branding control that maintains your application’s design integrity, purpose-built multi-tenant architecture that scales with your business, and comprehensive self-service tools that reduce support burden while increasing customer satisfaction.
Ready to deliver analytics instead of building them? Try Qrvey today and turn embedded analytics into your competitive edge.

Natan brings over 20 years of experience helping product teams deliver high-performing embedded analytics experiences to their customers. Prior to Qrvey, he led the Client Technical Services and Support organizations at Logi Analytics, where he guided companies through complex analytics integrations. Today, Natan partners closely with Qrvey customers to evolve their analytics roadmaps, identifying enhancements that unlock new value and drive revenue growth.
Popular Posts

Why is Multi-Tenant Analytics So Hard?
BLOG
Creating performant, secure, and scalable multi-tenant analytics requires overcoming steep engineering challenges that stretch the limits of...

How We Define Embedded Analytics
BLOG
Embedded analytics comes in many forms, but at Qrvey we focus exclusively on embedded analytics for SaaS applications. Discover the differences here...

White Labeling Your Analytics for Success
BLOG
When using third party analytics software you want it to blend in seamlessly to your application. Learn more on how and why this is important for user experience.