What is SaaS Analytics? Use Cases, Implementation & More
 Natan Cohen··18 min read
⚡Key Takeaways
- SaaS analytics is how SaaS companies collect, measure, and act on data across their product, business operations, and customer-facing features
- The most important SaaS analytics metrics include MRR, ARR, NPS, CAC, CLTV, and ARPU
- Choosing the right SaaS analytics tools depends on your stage; startups may start with simple event tracking, while scaling platforms need a full-stack solution like Qrvey to manage complex data at a flat rate
There’s a version of your product your competitors are shipping right now, one where customers can filter, drill down, and answer their own data questions without filing a support ticket.
If your current SaaS analytics experience doesn’t look like that, you’re already behind in renewal conversations you haven’t had yet.
This guide walks through what separates analytics that drive retention from those that drive exports. You’ll get a clear picture of what to build, what to buy, how multi-tenant data architecture affects every decision you make, and where most SaaS teams lose time.
What is SaaS Analytics?
SaaS analytics means collecting and analyzing data generated by a SaaS product, across usage, revenue, customer behavior, and operations, to make better product and business decisions and can be split into:
- SaaS business analytics: tracking metrics like MRR, churn, and CAC to understand the health of the business
- Embedded analytics: providing a live, interactive view of customer data, directly inside their product
The Benefits of SaaS Analytics
The real value of SaaS analytics shows up in these outcomes.
Faster Decisions With Less Guessing
When your product team can see which features are driving retention and which ones users ignore, roadmap prioritization starts being obvious.
Data analytics for SaaS replaces gut-feel decisions with signal-backed ones.
Reduced Churn Before It Happens
Nearly 70% of new users stop using software within three months. If you’re not tracking where they drop off, you’re flying blind into your renewal conversations.
SaaS data analytics lets you spot disengagement patterns early, flagging which customers are sliding toward churn so you can intervene before it’s too late.
Higher Net Revenue Retention
The median net revenue retention (NRR) for SaaS companies is 102%. High-performing SaaS companies aren’t just retaining revenue; they’re growing it from existing customers through upsells and expansions.
That kind of result is driven by analytics that surface the right expansion triggers at the right time.
Analytics as a Revenue Line
Embedded analytics is a monetization layer most teams miss. Offer basic dashboards on the free tier and charge for advanced reporting, custom visualizations, or automated workflows.
VIDEO: Where SaaS teams should start with customer-facing self-service analytics
Key Metrics & KPIs: What Should You Track?
The metrics below are your compass. Track them together and you’ll have a clear picture of what’s working and what isn’t.
1. Monthly Recurring Revenue (MRR)
MRR tells you how much predictable revenue you’re generating each month and whether that number is trending up or down. Track MRR broken down by new, expansion, contraction, and churned to understand what’s actually driving changes.
2. Annual Recurring Revenue (ARR)
ARR zooms out to give you the full-year picture. Smart SaaS teams track new ARR separately from total ARR because a flat total ARR could mean you’re winning as much as you’re losing, which is a very different story than compounding growth.
3. Customer Acquisition Cost (CAC)
CAC tells you how much it costs to land a new customer. Pair it with CLTV to get your CAC payback period. If it takes 18 months of revenue to recover what you spent acquiring a customer, that’s a cash flow problem waiting to surface.
4. Average Revenue Per User (ARPU)
Flat ARPU usually means you’re adding lower-tier customers or not upselling. Rising ARPU signals expansion into higher-value use cases
5. Net Promoter Score (NPS)
Customers usually get unhappy first before churning. A declining NPS gives you a window to act before those conversations turn into contract cancellations.
6. Customer Lifetime Value (CLTV)
CLTV helps you decide where to invest. If your enterprise segment has a CLTV three times higher than your SMB segment, that should inform where your product roadmap, CS resources, and marketing budget go.
Embedded Analytics for SaaS
Embedded analytics is when you build dashboards, reports, data visualisations, and self-service insights directly into your SaaS product. Instead of sending users to a separate BI tool, you give them access to the data they need inside the platform they already use.
This matters because most SaaS companies do not start as analytics businesses. But as your product grows, customers expect better reporting, faster insights, and more control over their data. Embedded analytics helps you meet those expectations without building every analytics feature from scratch.
Why SaaS Companies Use Embedded Analytics
SaaS companies use embedded analytics to:
- Enhance customer engagement and retention: Users can access reports, dashboards, and performance insights directly inside the platform, which keeps them active and invested. Providing these native data experiences is one of the most effective strategies for retaining SaaS customers over the long term.
- Differentiate your SaaS product: Built-in analytics gives end customers more value from your platform and makes it easier to stand out from similar tools.
- Reduce customer churn: When users can track progress and prove results inside your product, they are more likely to keep using it.
- Enable faster decision-making: Real-time dashboards help users act on data quickly without exporting reports or waiting for manual updates.
- Reduce support and training costs: Self-service analytics helps users answer their own questions, reducing the need for manual reporting support.
- Strengthen stakeholder buy-in: Clear analytics help managers, executives, and buyers measure ROI, track performance, and justify continued investment.
- Create monetization opportunities: Advanced dashboards, forecasting, and reporting features can be packaged into premium tiers, add-ons, or services.
VIDEO: How Can SaaS Companies Monetize Embedded Analytics?
KPIs For Embedded Analytics Success
To measure embedded analytics success, you need to track more than feature usage. The right KPIs should show whether users adopt the analytics experience, engage with it regularly, get value faster, and help your SaaS business improve retention, revenue, and profitability.
Here’s some of the KPIs that you should track:
| KPI | What it measures |
|---|---|
| Active analytics users | The percentage of users who interact with embedded dashboards, reports, or analytics features. |
| Tenant adoption rate | The percentage of customer accounts using embedded analytics. |
| Dashboard and report usage | How often users open dashboards, view reports, or return to analytics features. |
| Self-service report creation | The number of custom reports, dashboards, or visualisations users create themselves. |
| Interaction frequency | How often users apply filters, drill into data, or customize dashboard views. |
| Data export rate | How often users export reports to PDF, CSV, or other formats. |
| Time-to-value | How quickly new customers get useful insights from their data. |
| Trial-to-paid conversion rate | The percentage of trial users who become paying customers after using analytics features. |
| Churn rate reduction | The decrease in customer churn linked to better reporting and analytics access. |
| Expansion revenue | Revenue from premium analytics tiers, add-ons, or advanced reporting features. |
| Support ticket reduction | The drop in support requests related to reporting, dashboards, or data access. |
| Profitability and margin impact | How embedded analytics reduces support costs, improves gross margin, and supports product profitability. |
| User satisfaction score | Feedback on dashboard usability, reporting value, and the overall analytics experience. |
| System performance | Query load time, dashboard response time, uptime, concurrency, and error rate. |
| Anomaly detection and alerts | Alerts for sudden revenue drops, failed API calls, user behaviour shifts, or performance issues. |
Types Of SaaS Analytics
SaaS analytics can cover different parts of your business, from how users engage with your product to how your marketing performs and what future customer behaviour might look like.
1. SaaS Product Analytics
Understand how users interact with your product: which features they use, where they get stuck, how long they stay. If 40% of your users never reach a specific feature, that could be an onboarding problem. You won’t know that without data analysis for SaaS at the product level.
2. SaaS Marketing Analytics
Track where customers come from, which campaigns convert, what the cost per lead is, and how acquisition channels perform against each other. This feeds directly into CAC and payback period calculations.
3. SaaS Predictive Analytics
Use historical data to forecast what’s likely to happen next, including churn probability for a specific account, likelihood of expansion, or revenue trajectory. Could be the difference between reacting to problems and preventing them.

How to Implement SaaS Analytics Without Creating Data Risks
Implementing analytics without a clear architecture plan leaves you with a patchwork of tools, inconsistent data, and (if you’re in a multi-tenant environment) serious security gaps.
Here’s how SaaS engineering teams typically structure the implementation correctly:
Step 1: Define What “Good” Looks Like Before You Build
Before building anything, define success in terms of decisions. Not “build dashboards,” but “why do enterprise users churn in month four?”
Most big data initiatives fail (as high as 80%) because no one defined what success looks like. For SaaS teams, the symptom is familiar: dashboards exist but no one trusts or uses them
Step 2: Audit Your Data Sources and Clean Them Up
Before any analysis, understand where your data lives. CRM, billing system, product database, support tool, each has a schema and a cadence. Map your data sources, identify duplicates, and establish which system is the source of truth for each metric.
If your MRR in Stripe doesn’t match your MRR in your CRM, fix that first.
Step 3: Choose the Right Analytics Stack for Your Architecture
For multi-tenant SaaS, architecture matters more than features. Tools designed for single-tenant use struggle with tenant isolation at scale. Row-level security across thousands of customers becomes fragile fast.
Purpose-built platforms like Qrvey handle this natively, reducing engineering overhead and delivering experiences that match what your customers expect.

Within months of implementing Qrvey, JobNimbus saw 70% adoption among their enterprise users because the analytics experience matched what enterprise customers needed.
You can also use our free ROI Calculator to compare the cost of buying vs. building your analytics layer in-house before you commit to a direction.
Step 4: Implement Security at the Data Layer, Not the UI Layer
UI-layer filters look secure but don’t scale.
Enforce tenant isolation at the query level and pass permissions through security tokens tied to your app’s auth system, so access control stays consistent as tenants and datasets grow.
Step 5: Deploy, Measure Adoption, and Iterate Fast
Deployment is the starting pistol. Track adoption metrics from day one: which tenants are using the analytics, which reports are being run, and which users have never logged in.
Low adoption usually signals one of three things:
- The features don’t match the user’s workflow
- The UX is too complex
- Users don’t know it exists.
VIDEO: Multi-Tenant Security in SaaS: Risk, Architecture & What to Evaluate
SaaS Analytics Best Practices
What separates useful analytics from ignored dashboards is how you manage and apply it. These are the practices SaaS teams rely on to keep data reliable, secure, and actionable.
Maintain Data Cleanliness
Bad data is worse than no data, creating false confidence. A product leader at a 300-person SaaS company who acts on a dashboard built from inconsistent or duplicate records is making decisions based on fiction.
Implement automated data validation at ingestion, run regular audits across your key metrics, and create a clear process for flagging anomalies before they pollute downstream reports.
Implement Robust Data Governance
91% of CIOs ranked data governance among their top challenges through 2029. If customers don’t trust the numbers in your product, they stop using the product.
Data governance means documenting who owns each dataset, who can access it, how long it’s retained, and how changes are managed.
It also means building white-label SaaS analytics experiences that carry your branding and your data policies, not a third party’s.

Monitor Data Constantly
Waiting for someone to “check the dashboard” isn’t monitoring. Build systems that alert you to broken pipelines, stale data, or unusual spikes. If your data stops being reliable, your product loses credibility instantly
Develop Actionable Reporting Using SaaS Analytics Metrics
Your reports should drive decisions, not just describe outcomes. Tie every metric to a clear action. Instead of surface-level trends, highlight patterns users can act on immediately.
Common SaaS Data Analytics Challenges
The real challenge with SaaS analytics is managing data complexity, security, and usability as your product grows.
Data Silos
- The problem: Each team optimizes their own tool without a shared data model
- The fix: A native multi-tenant data lake that ingests from multiple sources and maintains tenant-level separation without manual ETL per customer
Technical Expertise
- The problem: Analytics expertise is genuinely specialized; most dev teams underestimate the ongoing maintenance burden
- The fix: Embedding an analytics platform built for SaaS means your engineering team inherits those capabilities without building them from scratch
Actionable Insights
A Salesforce survey reported 55% of employees using AI tools that hadn’t been approved by their organization. That’s a signal that people are going outside official tools to get answers their current system can’t provide quickly enough.
- The problem: Dashboards get built; insights don’t get used
- The fix: Self-service analytics that let tenants explore their own data without waiting on your product team, combined with analytics as a service capabilities that scale across customer segments
VIDEO: How SaaS Companies Win With Self-Service Analytics and AI
SaaS Analytics Platforms
Most SaaS companies didn’t get into business to build a reporting engine. As you grow, managing custom-built analytics becomes an expensive distraction. That’s why leaders opt for specialized saas analytics tools.
Here’s a look at the leading SaaS analytics platforms worth evaluating:
Qrvey
Qrvey is one of the few embedded analytics platforms architected for multi-tenant SaaS from day one. Most competitors started as single-tenant tools and bolted on tenant isolation later but Qrvey’s architecture was built for it from day one.

This means tenant isolation, row-level security, and self-service reporting work the way they should without custom engineering work per customer.
- Key Features: Native data lake, AI Chart Builder, and pixel perfect reports
- Pros: Deploys in your AWS/Azure VPC; flat-rate pricing with unlimited users and tenants
- Cons: Not suitable for simple internal-only reporting
- Pricing: Flat annual rate (Qrvey Pro or Ultra) with no per-user fees
Mixpanel
A popular choice for SaaS product analytics tracking user behavior.

- Pros: Strong event-based tracking.
- Cons: Costs scale steeply with data volume.
HubSpot
HubSpot is great for SaaS marketing analytics.

- Pros: Combines CRM and marketing reporting
- Cons: Not built for embedded use cases.
Shaping the Future: Emerging Trends in SaaS Analytics
AI-Powered Insights
Natural language queries are quickly becoming table stakes. Instead of asking your data team to build a new report, your customers type words and the chart appears.
Qrvey’s AI Chart Builder already supports this:

Users can create visualizations from plain-language requests and ask follow-up questions directly from a chart using Qrvey’s embedded AI analytics.
See how conversational AI with MCP can work in your SaaS product in this clickable demo.
Real-Time Analytics
Batch reporting isn’t enough for operational SaaS products. Real-time data analytics saas allows users to see the immediate impact of their actions, which is vital for operational tools like supply chain or healthcare software.
Rise of Self-Service Analytics
- Self-service analytics reduces feature request volume and increases product stickiness
- For multi-tenant SaaS, this means every tenant can customize their analytics experience, not just a preconfigured dashboard that may or may not match their workflow

After embedding Qrvey, CrowdChange replaced expensive third-party consultants with self-service filtering and real-time fundraising data for its clients.
Security and Privacy Concerns
With tightening global regulations, data sovereignty is a competitive advantage. Deploying your analytics SaaS within your own cloud environment (like Qrvey’s VPC deployment) ensures you stay compliant.
Example: How Healthcare is Taking Advantage of SaaS Analytics
Healthcare is one of the most demanding test cases for multi-tenant SaaS analytics. Patient records, claims data, clinical trial registrations, and billing systems all live in different schemas, fall under different compliance frameworks, and serve different end users.
A SaaS platform serving multiple practices has to handle all of that without leaking data across tenant lines.
Understanding the performance of doctor’s offices
One area where healthcare analytics software shines is in understanding the performance of doctor’s offices and medical practices.
By analyzing data on patient visits (AKA FHIR analytics), procedural codes, and revenue cycles, practices can identify areas for improvement, streamline operations, and enhance patient experiences.
Understanding payments data
Another crucial application of healthcare analytics is in understanding payments information, such as collections and insurance billings.
With real-time visibility into billing data, organizations can optimize their revenue cycle management, identify payment trends, and ensure accurate reimbursements from insurance providers.
Understanding clinical trial registration data
Furthermore, SaaS analytics plays a vital role in clinical trial research. By analyzing data from clinical trial registrations, researchers can gain insights into patient populations, study demographics, and potential areas for further investigation.
This not only facilitates more efficient and effective clinical trials but also contributes to the advancement of medical knowledge and the development of new treatments.
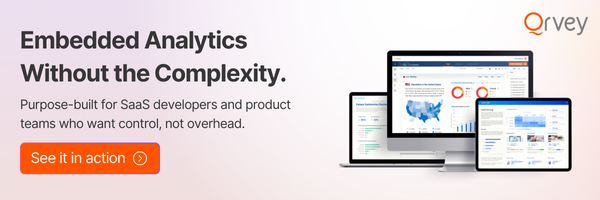
Start Using Qrvey’s Embedded Analytics: Built for SaaS
If your engineering team is maintaining a custom analytics layer while your customers are still exporting to spreadsheets, you’re paying twice for a problem that’s getting worse, not better.
Qrvey helps SaaS teams deliver embedded multi-tenant analytics in weeks while handling the multi-tenancy, security, and self-service capabilities that actually drive adoption.
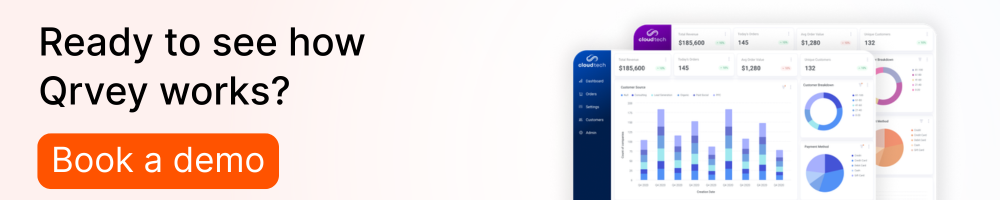
Ready to see this for your product? Book a demo.
FAQs
Qrvey is a fully deployed solution hosted by you. It installs directly into your own AWS or Azure cloud account, ensuring you maintain total control over your data.
Yes, Qrvey dashboards act as mashed up views. You can source industry-wide metrics from commingled datasets while pulling private, tenant-specific metrics from isolated datasets into the same UI.
Qrvey provides “Live Connect” datasets that query data “in-place.” This minimizes egress and movement by generating optimized queries that run directly against your existing SQL-compliant databases.
Natan brings over 20 years of experience helping product teams deliver high-performing embedded analytics experiences to their customers. Prior to Qrvey, he led the Client Technical Services and Support organizations at Logi Analytics, where he guided companies through complex analytics integrations. Today, Natan partners closely with Qrvey customers to evolve their analytics roadmaps, identifying enhancements that unlock new value and drive revenue growth.