


⚡Key Takeaways
- Qrvey: Best for B2B SaaS product and engineering teams that need to embed analytics directly into their product for external, multi-tenant users.
- Google Looker: Best for Google Cloud environments; strong semantic layer and governed data modeling for large teams
- Microsoft Power BI: Best for Microsoft-stack organizations that need affordable, fast-to-deploy dashboards for internal teams.
- Tableau: Best for professional data analysts and enterprise teams doing complex internal data discovery with advanced visualization needs.
When enterprise customers churn, they rarely say it’s because of the analytics. You hear the product “didn’t meet their needs.” But dig into the exit interviews and you’ll often find the same thread: reporting was too rigid, too slow, or too generic. That’s a BI tool problem.
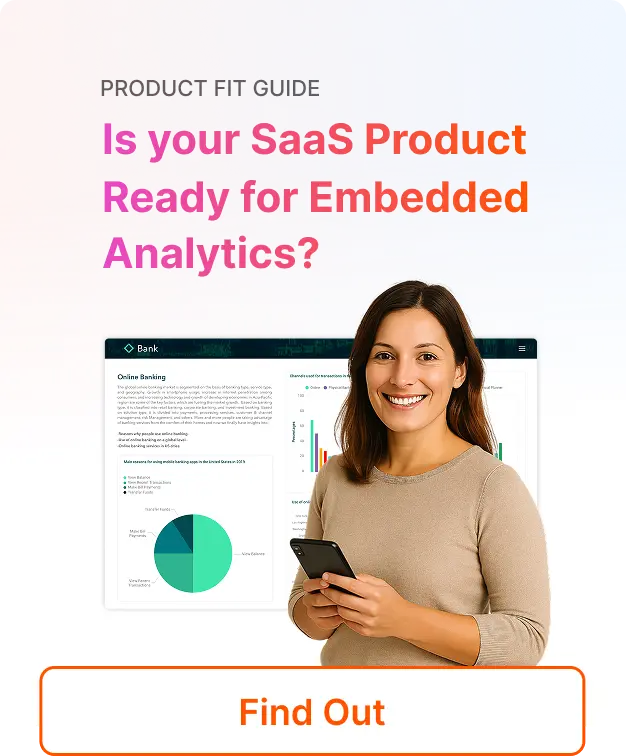
The market for BI tools is crowded but most platforms were designed for internal use, and the architecture shows the moment you try to embed them for external users at scale. This guide covers nine options for 2026, what each one is genuinely good at, and where the multi-tenant SaaS use case exposes its limits.
| Tool | Best For | Standout Feature | Starting Price |
|---|---|---|---|
| Qrvey | SaaS teams embedding analytics for external users | Native multi-tenant architecture + JS embeds | Custom flat-rate |
| Google Looker | Google Cloud enterprises with data engineering teams | LookML semantic layer | Call sales |
| Microsoft Power BI | Microsoft-stack internal analytics | Native Excel/Teams integration | $14/user/mo |
| Amazon QuickSight | AWS-native SaaS with budget-conscious embedding | SPICE in-memory engine | $24/author/mo |
| Tableau | Enterprise internal data discovery | VizQL drag-to-query engine | $75/user/mo |
| ThoughtSpot | Non-technical users querying large cloud datasets | Natural language “Spotter” AI agent | $25/mo (50 users) |
| Zoho Analytics | SMB teams in the Zoho ecosystem | “Ask Zia” NLP assistant | $24/mo |
| Domo | Non-technical departments needing fast dashboards | 1,000+ pre-built data connectors | Call sales |
| Qlik Cloud Analytics | Data-heavy enterprises needing associative exploration | Proprietary Associative Engine | $300/mo |
What Is Embedded BI Software?
Embedded BI software integrates analytics capabilities such as dashboards, reports, and data visualizations directly into an existing application. Instead of logging into a separate analytics platform, users see their data inside the tools they already use every day.
Why Can’t You Embed Traditional BI Solutions Into SaaS Products?
Most traditional BI tools were built for internal departments (HR, Finance, Marketing) where every user is known. In a SaaS product, you have tenants.
Traditional tools struggle with multi-tenancy because they weren’t designed to isolate data for thousands of separate customers within a single infrastructure.
If you try to force an internal tool into a SaaS app, you’ll hit per-user licensing costs that kill your margins and security headaches that require manual workarounds for row-level security.

1. Qrvey: Best for SaaS Teams Embedding Analytics for External Users
While Qrvey isn’t built for traditional spreadsheets, it’s the only embedded analytics platform purpose-built for SaaS companies serving external, multi-tenant users.
It solves the build vs. buy dilemma by providing a production-ready analytics layer that scales with your application.
Qrvey Key Features
Qrvey is designed for the high-stakes environment of customer-facing software, where performance and security are non-negotiable.
1. Native Multi-Tenant Architecture with Security Token Authentication
Unlike internal tools that require a one-to-one mapping of users to licenses, Qrvey’s engine is built for “tenant awareness.” It handles co-mingled or segregated data models natively, ensuring that Tenant A can never see Tenant B’s data.
Take a peek at how Qrvey approaches RLS in this clickable demo.
This architecture allows a product leader at a 300-person SaaS company to scale to thousands of users without manual security configuration.
2. Fully Embeddable via JavaScript
Every piece of Qrvey (dashboard builders, filters, pixel-perfect reports, workflow automation) embeds via JavaScript widget.
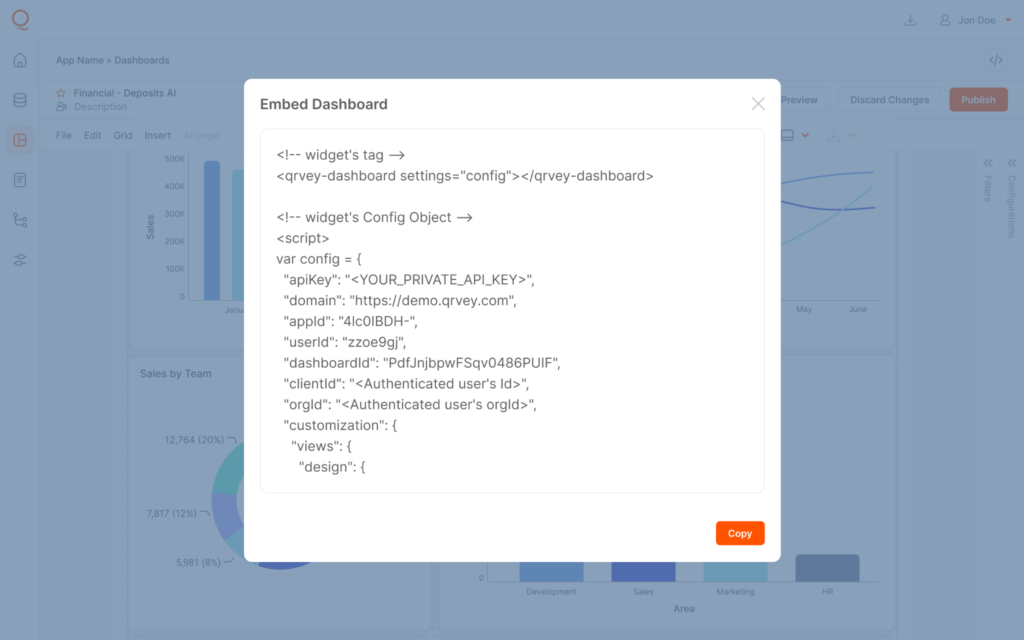
Product teams control every pixel and your customers never see the word “Qrvey.” The white-label analytics experience is complete.
3. AI Chart Builder + Conversational Insights
Qrvey’s AI Chart Builder allows your end-users to create visualizations using natural language.
Instead of filing a ticket with your engineering team, a customer can simply type, “Show me the total sales by region,” and the AI generates the visual instantly, inheriting the app’s existing security permissions.
See how conversational AI with MCP works in this clickable demo.
For SaaS product teams worried about AI adoption, JobNimbus saw 70% adoption among targeted enterprise users within months of deploying Qrvey.
Partly because the self-service experience made analytics accessible to non-technical contractors who previously didn’t engage with reporting at all.
If you’re mid-evaluation: Build a concrete business case with our free ROI Calculator to compare Qrvey vs. building in-house across timeline, cost, and maintenance.

4. No-Code Dashboard Builder
With Qrvey’s intuitive no-code builder, users can create a personalized dashboards and reports without technical expertise. Drag-and-drop functionality makes it simple to visualize data, customize layouts, and share insights instantly.
This empowers product teams and end-users to build analytics experiences tailored to their needs.
See how Qrvey’s dashboard builder works in this clickable demo below
Qrvey Pricing
| Plan | Details |
|---|---|
| Pro | Embedded dashboards, AI, automation |
| Ultra | Adds data engine + transformation layer |
| Model | Flat-rate, unlimited users, dashboards, instances, data, and connections |

Where Qrvey Shines
- Predictable Scaling: Qrvey’s flat-rate licensing means costs don’t climb just because your user base does
- DevOps Friendly: Qrvey supports CI/CD pipelines and container orchestration (Kubernetes), making it easy for engineering teams to manage across dev, test, and production environments
- Full UX control: JavaScript embeds, complete white-labeling
Where Qrvey Falls Short
- Qrvey is purpose-built for customer-facing use cases. If you need a dashboard for your own finance or ops team, a traditional tool on this list is a better fit
- If you serve one large customer with one data model, Qrvey’s architecture might be more than you need
Qrvey Customer Reviews
“Qrvey is one of the only tools out there that gives us the ability to embed a full suite of analytics into web apps. Qrvey’s embed capability goes beyond charts and dashboards, letting us integrate a full analytics authoring interface into apps.” – Dara Kharabi, Product Lead @ Farlinium
“Qrvey democratizes insight and data in a way our customers—and even we internally—never had before. It’s an immensely powerful tool embedded in our day-to-day operations.” – David Anderson, CEO at EvenFlow.ai
Who Qrvey is Best For
- Product leaders at B2B SaaS companies: Managing a roadmap where analytics feature requests are consuming engineering capacity and the current solution isn’t delivering the self-service experience customers want
- Engineering leaders and CTOs: Who need to embed a full analytics stack (including data management, security, and visualization) without building and maintaining it in-house
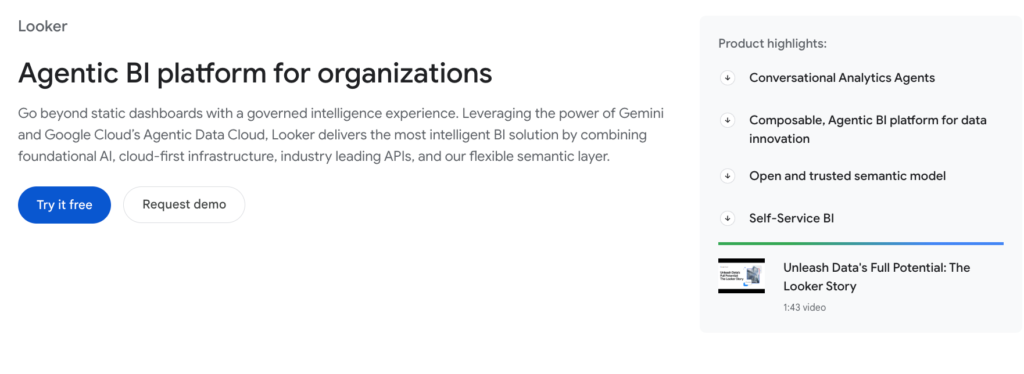
2. Google Looker: Best for Google Cloud Enterprises With a Governed Data Model
Looker is an analytics platform that uses LookML, a code-based semantic layer with Git integration, to define metrics once, instead of recreating them in every dashboard.
Key Features
- Git Integration: Allows data analysts to use developer workflows for version control of their data models
- Persistent Derived Tables (PDTs): Pre-computed query results for expensive calculations, improving performance without re-running complex SQL on every load
- API-first embedded analytics: Looker can embed into external products, though multi-tenant implementations require significant custom engineering work from your team
- Gemini AI integration: Natural language querying via Google’s AI ecosystem
Pricing
Three tiers: Standard, Enterprise, and Embed, all require contacting sales.
Where Looker Shines
- Google Ecosystem Integration: Looker is tightly integrated with Google Cloud and other Google services, making it a natural fit for teams already using Google infrastructure
- Internal Embedding: A natural fit for teams embedding analytics within their own internal tools and workflows, particularly for Looker embedded analytics deployments
- AI Capabilities: Enhanced by Google Gemini, Looker offers strong AI-powered insights and automation
Where Looker Falls Short
- Complex Multi-Cloud Setup: While deploying outside Google Cloud is supported, it’s technically complex and resource-intensive to configure
- Limited Multi-Tenancy: Not optimized for external, customer-facing analytics in SaaS environments
- Requires External Data Engine: Looker depends on a separate data warehouse, making it less suitable for teams without an existing data infrastructure
- Steep Learning Curve: LookML requires technical expertise, which can slow onboarding for non-technical teams
Customer Reviews
“I like that Looker makes it easy to explore and understand data. LookML helps keep reports and metrics consistent, and the connection with Google Cloud makes managing data smoother.” – Verified G2 review
“Looker can be hard to learn at first, especially with LookML. Some charts and visuals are limited, and it can slow down with big datasets. The interface isn’t always friendly for beginners, and setup usually needs help from a developer. Better self-service guides would also make it easier to get started.” – Verified G2 review
Who Looker is Best For
- Enterprise data teams on Google Cloud with dedicated data engineering resources and a need for consistent, governed metrics across a large organization
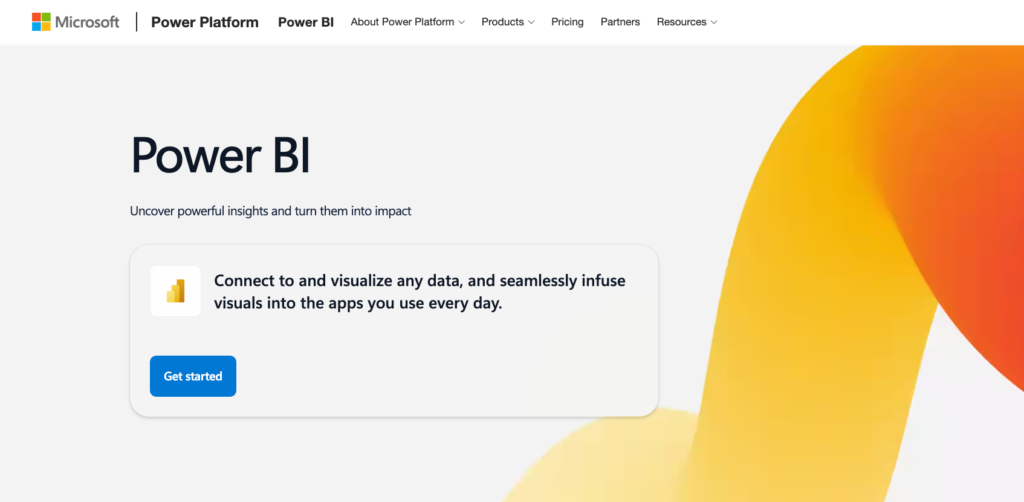
3. Microsoft Power BI: Best for Microsoft-Stack Internal Analytics
Power BI is the natural choice for businesses deeply invested in Microsoft’s ecosystem. Its seamless integration with Office 365 and Azure makes it ideal for internal analytics and quick, organization-wide adoption.
Key Features
- Deep Microsoft integration: Native connections to Excel, Teams, Azure, and SharePoint
- Power Query: A visual data transformation interface that doesn’t require SQL
- Natural language Q&A: Ask questions about your data in plain English
- DAX formula language: Powerful, but carries a steep learning curve
Pricing
| Plan | Price |
|---|---|
| Pro | $14/user/mo |
| Premium | $24/user/mo |
Where Power BI Shines
- Seamless Microsoft Integration: Native connectivity with Azure, Dynamics 365, and the entire Power Platform creates a powerful, cohesive data ecosystem for Microsoft-centric businesses
- Rapid Self-Service Analytics: Its intuitive drag-and-drop interface empowers business users to build their own reports and dashboards without heavy IT reliance.
- Enterprise-Grade Governance: Robust security, governance, and deployment pipelines through Power BI Service make it a trusted choice for large-scale organizational deployment
Where Power BI Falls Short
- DAX Complexity: Finance and engineering teams consistently flag the formula language as a barrier to self-sufficiency
- Complex Data Transformation: It struggles with multi-step, sophisticated data modeling natively, often pushing users to pre-process data elsewhere
- Cost and Licensing Complexity: The Pro/Premium tiers can become expensive, and the licensing model is often confusing for small businesses or individual users
Customer Reviews
“Microsoft Power BI is easy to implement with strong integration across Excel, SQL, and cloud services, making it highly usable for daily reporting.” – Verified G2 review
“Power BI has some limitations when it comes to working with very large datasets, where performance can become an issue, and it also requires Power BI Pro to share reports. I’ve found that advanced DAX calculations come with a steep learning curve, and overall customization feels less flexible than with some open-source BI tools.” – Verified G2 review
Who Power BI is Best For
- Internal teams inside Microsoft-stack enterprises who need scalable, affordable reporting without a dedicated BI developer
4. Amazon QuickSight: Best for AWS-Centric Organizations
Amazon QuickSight is designed for organizations operating in the AWS ecosystem.
Its serverless architecture, pay-per-session pricing, and built-in machine learning make it a cost-effective, scalable solution for cloud-first businesses.
Key Features
- SPICE engine: Accelerates queries by caching data in memory
- Amazon Q: Natural language querying built into the platform
- Session-based reader pricing: Pay-per-session model for infrequent users ($0.30/session, capped at $5/month)

Pricing
| Pricing model | Pricing |
|---|---|
| Per-user pricing | Starting at $3 per month per Reader |
| Capacity pricing | Starting at $250 per month for 500 sessions |
Where QuickSight Shines
- Cost-Effective Scaling: Its unique pay-per-session pricing model makes it exceptionally affordable for large-scale deployments with infrequent users
- Native AWS Integration: Tightly woven with the AWS ecosystem (Redshift, S3, RDS) for seamless, secure, and high-performance data connectivity
- Serverless & Embedded Ease: A truly serverless analytics simplifies management and allows for easy, scalable embedding of analytics in other applications
Where QuickSight Falls Short
- Limited Self-Service Agility: Its data preparation and modeling capabilities are less intuitive than competitors, often requiring IT to pre-build datasets for business users
- Immature Ecosystem: It lacks the extensive marketplace of custom visuals, connectors, and community resources found in more established platforms
- Basic Advanced Analytics: Native support for complex statistical functions, forecasting, and R/Python integration is limited compared to other enterprise tools

Customer Reviews
“Fast dashboard performance, native AWS integration, scalable for large datasets, pay-per-session pricing, easy SPICE setup, decent visualization options” – Verified G2 review
“Limited visualization customization, learning curve for calculated fields, UI feels less intuitive, sharing and permissions can be confusing, dependency on AWS ecosystem” – Verified G2 review
Who QuickSight Is Best For
- AWS-Centric Organizations: Companies heavily invested in the Amazon Web Services ecosystem benefit from seamless, secure, and native integration with data sources like Redshift and S3
- Large-Scale & Cost-Conscious Teams: Its pay-per-session pricing model is ideal for embedding analytics or distributing reports broadly to users who access them infrequently
5. Tableau: Best for Enterprise Internal Data Discovery
Tableau is the leading BI tool for organizations that prioritize advanced data visualization and storytelling. It’s ideal for enterprises and data professionals who need deep analytics and highly interactive dashboards.
Pricing
| Role | Price |
|---|---|
| Creator | $75/user/month |
| Explorer | $42/user/month |
| Viewer | $15/user/month |
Where Tableau Shines
- Great Visual Design: Offers superior flexibility for creating highly customized, complex, and aesthetically stunning data visualizations
- Rapid Ad-Hoc Discovery: Its intuitive drag-and-drop interface is ideal for fast, interactive data exploration and deep analytical drilling
- Handling Complex Logic: Powerful features like Level of Detail (LOD) expressions easily manage sophisticated calculations across different data granularities
Where Tableau Falls Short
- High Cost: Pricing can be prohibitive for smaller businesses
- Steep Learning Curve: Requires training for advanced features
- Performance Demands: Large datasets may require robust infrastructure
Customer Reviews
“I have been using Tableau for data analysis and dashboard creation, and it’s a very powerful and user-friendly BI tool. It helps convert complex data into clear, interactive, and visually appealing dashboards that are easy to understand for both technical and non-technical users.” – Verified G2 review
“One of the biggest challenges with Tableau is the pricing model. The licensing cost can be expensive, especially for small teams or individual users. Viewer, Explorer, and Creator licenses can add up quickly as teams scale, and this sometimes limits wider adoption across the organization.” – Verified G2 review
Who Tableau is Best For
- Data Analysts and Scientists: Professionals who require deep, ad-hoc exploratory analysis and the power to build complex, custom calculations and visualizations
- Design-Focused Organizations: Teams that prioritize data storytelling and need to create highly customized, publication-quality, and interactive dashboards
6. ThoughtSpot: Best for Search-Driven Self-Service at Scale
ThoughtSpot uses an AI agent called “Spotter” to translate natural language into visualizations. It is built for companies that want to move away from static dashboards and toward conversational insights.
Pricing starts around $25/month for the Essentials tier but scales quickly based on data volume. ThoughtSpot is best for large enterprises with Snowflake or Databricks that want to empower non-technical executives to find their own answers.

7. Zoho Analytics: Best for SMBs in the Zoho Ecosystem
Zoho is a low-cost, AI-powered platform that excels at blending data from different sources (like CRM, Finance, and Marketing) into a single view. The “Ask Zia” assistant is remarkably capable for the price point.
Basic plans start at $24/month and the tool is best for small to mid-sized businesses that already use parts of the Zoho suite or need quick, multi-department reporting.
8. Domo: Best for Non-Technical Departments Needing Fast Dashboards
Domo is a cloud-native platform that focuses on speed and ease of use for business leaders.
It includes its own data warehouse and ETL tools (Magic ETL), making it a one-stop shop.
This BI tool is designed for companies that want to bypass a traditional IT setup and get dashboards running in days. But you get consumption-based pricing that’s generally considered “premium” (expensive).
Domo is best for marketing and sales departments that need mobile-first, real-time data without a dedicated data engineering team.

9. Qlik Cloud Analytics: Best for Associative Data Exploration at Scale
Qlik’s proprietary associative engine allows users to explore data relationships that traditional SQL-based tools might miss.
Compared to linear tools where you drill down from A to B, Qlik allows you to see what data is not related to your search, uncovering hidden patterns. It’s a powerhouse for complex, high-volume data environments. Plans start at $300/month.
Qlik is best for data-heavy organizations that require high-performance, self-service exploration, and AutoML capabilities.
How to Choose the Right BI Software for Your Use Case
Before you compare features, you need to answer one question: are you building analytics for your own internal team, or for your paying customers? Everything else flows from there.
Who Are Your End Users?
Are you building analytics for your own internal team, or for your paying customers? If your customers log into your SaaS product and need to see their own data, you’re not looking for a traditional BI tool.
What tools like Tableau, Power BI, and Looker do is internal analytics. Adapting them for multi-tenant, customer-facing use requires custom security layers, additional middleware, and per-user licensing structures that get expensive fast.
Qrvey is built specifically for the multi-tenant SaaS use case, providing automated row-level security that ensures Tenant A can never access Tenant B’s data. This native isolation turns data security from a constant manual audit into an automated part of your infrastructure.
VIDEO: Multi-Tenant Security in SaaS: Risk, Architecture & What to Evaluate
Deployment and Data Control
Cloud-based deployments are projected to hold 50.55% of the BI market soon. For SaaS companies, that shift comes with a serious question about where customer data lives.
If your analytics vendor runs on shared infrastructure, you’re accepting a risk your enterprise customers probably won’t accept forever.
Qrvey deploys entirely within your own AWS or Azure environment. Your data never touches Qrvey’s servers. For SaaS companies with SOC 2, HIPAA, or enterprise security requirements, this is the requirement that determines whether procurement says yes or no.

Self-Service Without Engineering Tickets
Having a customer who needs a new chart wait because your engineering team is three sprints deep on a product initiative is a churn risk.
Self-service analytics ,where end users build their own dashboards, apply their own filters, and create their own reports, is the feature that keeps customers inside your product instead of exporting to spreadsheets.
Qrvey’s dashboard builder lets tenants customize their own analytics environment without requiring SQL knowledge or support tickets. User permissions control exactly what data each role can access and what they can build.
The benefits of self-service analytics compound over time: lower support volume, higher product engagement, and fewer analytics feature requests eating your roadmap.
Advanced Analytics & AI Capabilities
Modern BI tools go beyond basic reporting, offering predictive analytics, machine learning, and AI-powered insights to help you anticipate trends and make proactive decisions.
Qrvey supports AI-powered analytics from both leading and custom large language models, and brings advanced Agentic AI capabilities that empower embedded analytics to drive action and orchestrate workflows across the SaaS ecosystem.
Curious how Agentic AI actually works in SaaS analytics? Watch a quick demo below.
Final Note on Qrvey
If your goal is internal reporting, any tool in this business intelligence tools list will likely work. But if you are a B2B SaaS company looking to monetize your data and protect your engineering roadmap, Qrvey is the only solution built specifically for your architecture.
You get to embed a complete, secure, multi-tenant analytics layer into your SaaS product. So your customers get a self-service analytics experience, and your engineering team doesn’t spend the next two years maintaining it.
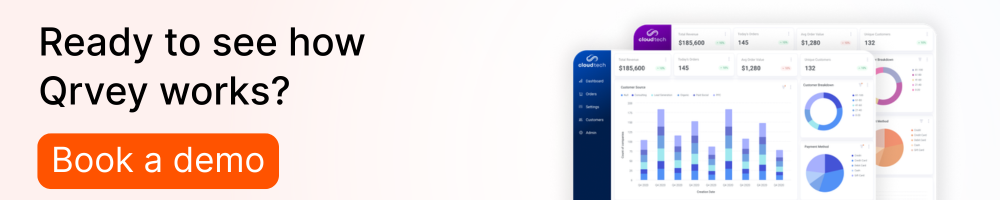
Book a demo to see how Qrvey helps SaaS teams deliver analytics in weeks.

David is the Chief Technology Officer at Qrvey, the leading provider of embedded analytics software for B2B SaaS companies. With extensive experience in software development and a passion for innovation, David plays a pivotal role in helping companies successfully transition from traditional reporting features to highly customizable analytics experiences that delight SaaS end-users.
Drawing from his deep technical expertise and industry insights, David leads Qrvey’s engineering team in developing cutting-edge analytics solutions that empower product teams to seamlessly integrate robust data visualizations and interactive dashboards into their applications. His commitment to staying ahead of the curve ensures that Qrvey’s platform continuously evolves to meet the ever-changing needs of the SaaS industry.
David shares his wealth of knowledge and best practices on topics related to embedded analytics, data visualization, and the technical considerations involved in building data-driven SaaS products.
Popular Posts

Why is Multi-Tenant Analytics So Hard?
BLOG
Creating performant, secure, and scalable multi-tenant analytics requires overcoming steep engineering challenges that stretch the limits of...

How We Define Embedded Analytics
BLOG
Embedded analytics comes in many forms, but at Qrvey we focus exclusively on embedded analytics for SaaS applications. Discover the differences here...

White Labeling Your Analytics for Success
BLOG
When using third party analytics software you want it to blend in seamlessly to your application. Learn more on how and why this is important for user experience.