Embedded Data: What It Is, How It Works, Types and Examples
 David Abramson··22 min read
⚡Key Takeaways
- Embedded data is really about the analytics experience. The data already exists in the SaaS product or connected systems; what gets embedded are dashboards, reports, self-service analytics, alerts, and AI capabilities that help customers use that data.
- A complete embedded data experience requires more than visualization: Data must be prepared, governed, secured by tenant and role, optimized for analytical workloads, and then delivered inside the product through embedded analytics components.
- SaaS teams can build analytics in-house, adapt an existing BI tool, or use a purpose-built embedded analytics platform: The best approach depends on required customization, multi-tenant complexity, time to market, and how much ongoing engineering work the team wants to own.
- Qrvey gives multi-tenant SaaS teams a purpose-built way to deliver these experiences with native multi-tenant security, built-in data management, self-service analytics, JavaScript embedding, governed AI and agents, AI-powered workflow automation, self-hosting, and flat-rate licensing without building the entire analytics layer themselves.
Most products collect or connect to useful business data. The gap is what users can actually do with it.
If customers still need exports, static reports, or support requests to understand what’s happening, the data may exist in the product, but the experience around it is incomplete.
Embedded data experiences close that gap by putting dashboards, reports, alerts, and self-service analytics directly into the user workflow.
This guide explains what embedded data means, how it works through embedded analytics capabilities, the main types, and practical examples.
What Is Embedded Data?
“Embedded data” generally refers to making data accessible and useful directly within a software application. More precisely, the data itself isn’t embedded. It already exists within the product or its connected data sources. What gets embedded is the analytics experience that helps users understand and act on that data.

This can include dashboards, reports, visualizations, alerts, self-service analytics, and AI-powered insights. Instead of exporting data or switching to a separate tool, users can explore trends, answer questions, and make decisions within the application they already use.
To see how these in-app insights shape customer retention and engagement, read our guide on delivering an embedded customer experience.
You can use an embedded analytics platform like Qrvey to add these customer-facing analytics experiences directly into your products without building and maintaining the entire analytics layer in-house.


Embedded Data vs Embedded Analytics vs Embedded BI
These terms are often used interchangeably, but they describe slightly different ideas. The biggest distinction is what is actually being embedded into the product and how much users can do with the data once they’re there.
| Term | What it means | What’s actually embedded | Typical experience |
|---|---|---|---|
| Embedded data | A broad term for making product data accessible and useful within an application. The data itself usually already exists in the product or connected data sources. | The experience used to access, understand, or interact with the data | Data views, reports, charts, alerts, or other in-product data experiences |
| Embedded analytics | Analytics capabilities integrated directly into a software product so users can explore data and generate insights without leaving the application. | The analytics layer and user experience | Interactive dashboards, self-service reporting, visualizations, AI insights, alerts, and automated workflows |
| Embedded BI | A more traditional approach to integrating business intelligence capabilities into another application, typically centered on reporting and dashboard consumption. | BI dashboards, reports, and visualization capabilities | Prebuilt dashboards, scheduled reports, filters, drill-downs, and KPI monitoring |
How Embedded Data Works
In practice, “embedded data” is a journey from operational product data to an analytics experience customers can actually use. The data may already exist in your application, warehouse, or other systems, but it still needs to be prepared, governed, secured, and optimized before it can reliably power customer-facing analytics.
1. Data Connects From the Systems Where It Lives
This stage gives the analytics layer access to the data generated by your product and connected systems.
Sources can include PostgreSQL and MongoDB databases, Snowflake, Redshift or Databricks warehouses, Amazon S3, REST APIs, uploaded files, and other SaaS applications. Some analytics architectures query those systems live, while others ingest selected data into an analytics-optimized environment.
That distinction matters because you don’t necessarily need to relocate everything.
2. Operational Data Becomes Analytics-Ready
Before customers can analyze it, operational data often needs to be joined, transformed, enriched, and reshaped for analytical queries.
Most SaaS databases are designed to create accounts, process orders, update records, and keep the application running. Those structures can be highly normalized and awkward for customer-facing analytics.
Preparing them may involve:
- Joining data across systems
- Blending related datasets
- Standardizing formats and data types
- Creating calculated fields
- Applying transformations and enrichment
- Reshaping data for faster aggregation
The purpose isn’t simply to “clean the data.” It’s to create datasets that can support dashboards, self-service exploration, reports, and AI without forcing complex transformations to run every time a customer asks a question.
Qrvey addresses this stage through its built-in Data Management Layer, which helps turn operational SaaS data into analytics-ready data.

Its data pipeline connects, synchronizes, transforms, and enriches data from different sources; the built-in data lake stores and optimizes that data for multi-tenant analytics workloads; and APIs let teams manage and automate data operations programmatically.
This reduces the need to stitch together separate tools for data movement, preparation, storage, and analytics delivery.
3. A Semantic Layer Defines What the Data Means
This stage turns technical schemas into consistent business concepts that every analytics experience can understand.
A field such as ord_val_total may become “Total Order Value,” while calculations such as revenue, utilization, or active customers can be defined once and reused everywhere.
The semantic layer can contain metrics, metadata, relationships, calculations, hierarchies, and business logic. That creates a common analytical language across dashboards, reports, self-service tools, and AI.
4. Security Determines What Each User Can Access
Before any result reaches the interface, access controls determine which data, metrics, and analytics capabilities the current user is authorized to see.
That can mean tenant scope, user roles, subscription entitlements, record-level access, column permissions, or restrictions on particular analytical objects.

Technologies such as JSON Web Tokens (JWTs), security tokens, row-level security, and role-based access controls can pass identity and permission context from the host application into the analytics layer.
With this architecture, the same analytics infrastructure can serve many customers while ensuring each user only receives the data and capabilities they’re permitted to access.
5. The Data Layer Is Optimized for Analytics Workloads
Customer-facing analytics also needs an architecture that can handle repeated queries, growing datasets, and concurrent users without slowing the product down.
Transactional application databases aren’t necessarily designed for hundreds or thousands of users simultaneously filtering dashboards, generating reports, and running ad hoc analysis.
Analytics architectures therefore use techniques such as analytics-optimized storage, synchronization, caching, indexing, sharding, aggregation, and query optimization to reduce unnecessary work at request time.
This is also where architecture choices around live queries versus cached or ingested data become important.
6. The Analytics Experience Is Rendered Inside the Product
Finally, the governed results are delivered through dashboards, reports, builders, AI interfaces, or other analytics components embedded into the SaaS application.

The analytics layer returns the appropriate result to dashboards, charts, reports, builders, AI interfaces, or other components inside the SaaS application. Platforms can integrate those experiences through JavaScript components, APIs, SDKs, web components, or iframes.
Qrvey uses JavaScript-based embedding and APIs so product teams can integrate analytics into their own interface while retaining control over branding, navigation, layouts, and user workflows.
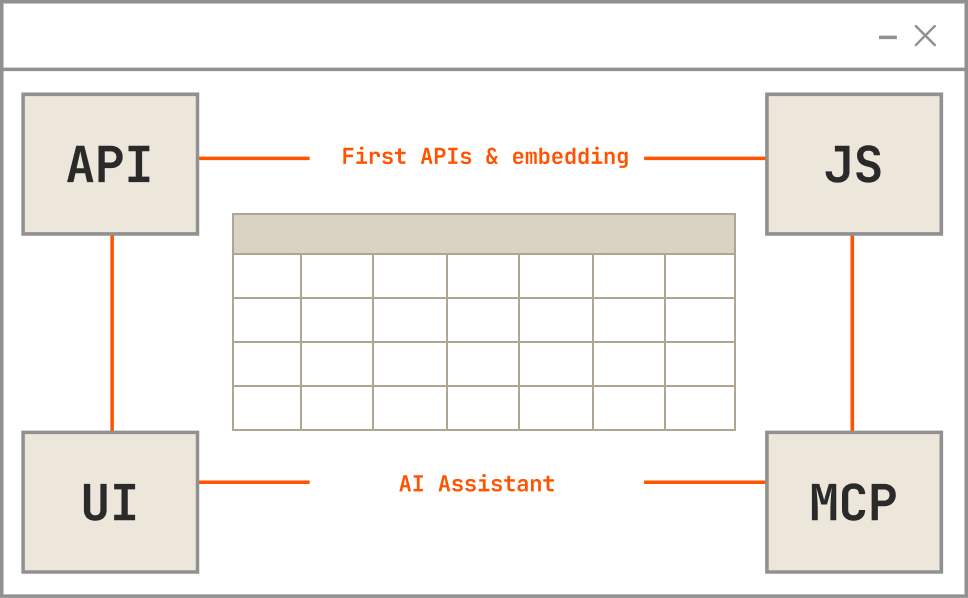
The user sees the experience as part of the SaaS product, not as a separate analytics application.
How Embedded Data Experiences Appear Inside SaaS Products
Customers rarely experience “embedded data” as raw records or database tables. They experience analytics capabilities built into the product: a metric beside the workflow they’re completing, a dashboard they can investigate, a report they can share, an alert that tells them something changed, or an AI assistant that helps them understand why.
1. Contextual Metrics Inside Everyday Workflows
Not every analytics experience needs to be a dedicated dashboard.
A CRM might show pipeline value next to an account. A logistics application might display delivery performance beside a shipment. A workforce platform could surface utilization or staffing trends while a manager builds a schedule.
These smaller KPI cards, charts, trends, and indicators put analytical context beside the decision they support. Users don’t have to leave the workflow and visit a separate “analytics” area first.
This is often the most seamless form of embedded analytics because the insight appears exactly where it becomes useful.
2. Interactive Dashboards for Deeper Exploration
When users need a broader view, embedded dashboards provide a space to monitor performance and investigate what’s driving it.
Modern experiences can go far beyond static charts. Users may be able to:
- Filter results dynamically
- Drill into individual categories or records
- Move between related dashboards
- Compare time periods
- Interact with multiple visualizations
- View updates as underlying data changes
The important difference from a separate BI tool is context. These dashboards live within the SaaS product, follow its design and permissions, and can connect directly to the workflows customers already use.
See how to build an interactive chart in Qrvey using AI in this clickable demo.
3. Self-Service Analytics Customers Can Shape Themselves
Some customers don’t just want to consume the dashboards you give them. They want to answer questions specific to their own business.
Self-service analytics can let authorized users create dashboards, customize existing views, save reports, choose dimensions and metrics, build new visualizations, or explore datasets themselves.
Product teams still establish the underlying data models, permissions, and guardrails. Within those boundaries, customers get considerably more freedom.
Qrvey supports this model by allowing SaaS companies to embed dashboard-building and self-service capabilities directly into their application, reducing the need for product or engineering teams to build a new report every time a customer asks for one.
Whether that’s by exploring data and building charts with AI, personalizing existing dashboards, or even embedding the dashboard builder, the platform enables the right level of self-service for all your user types.
4. Operational and Pixel-Perfect Reports
Some data needs to be explored. Other data needs to leave the screen in a very specific format.
Embedded reporting can support financial statements, invoices, compliance documents, operational summaries, account reports, or other outputs customers need to distribute or archive.
Pixel-perfect reporting adds precise control over page dimensions, tables, headers, pagination, branding, and print-ready formatting.

This makes reports a different experience from dashboards rather than simply a static version of one. Dashboards help users investigate. Pixel-perfect reports help them produce a consistent business document from the same governed analytics foundation.

5. Proactive Alerts and Automated Workflows
Analytics does not always need to wait for someone to open a dashboard. SaaS products can monitor defined conditions and respond when something changes, turning analytics from a passive reporting layer into part of the operational workflow.

For example, the product could:
- Alert a user when inventory falls below a threshold
- Notify an account manager when customer usage drops sharply
- Flag an SLA that is approaching its limit
- Create a task when an operational KPI moves outside an expected range
- Trigger a webhook or update another system when predefined business rules are met
This shortens the gap between something changing in the data and the appropriate response beginning. Qrvey’s AI-powered workflow automation connects analytics signals to the next operational step. SaaS teams can define workflows around analytics events, thresholds, status changes, or other conditions, then trigger notifications, escalations, write-backs, integrations, or other actions automatically.

Qrvey Sidekick and AI Agents can also add conversational guidance and contextual recommendations to those workflows.
Build a workflow right now in Qrvey’s Developer Playground.
6. Conversational Analytics and AI-Generated Answers
Increasingly, the analytics interface itself can be a conversation.
Instead of knowing which dashboard to open or which filter to apply, a user can ask a question in natural language, generate a visualization from a prompt, request an explanation of a trend, or ask follow-up questions about an existing chart.
The useful version of this isn’t a generic chatbot sitting beside the product. It operates on the same governed metrics, metadata, security rules, and customer context as the rest of the analytics experience.
Qrvey extends this model through Sidekick, AI Agents, Custom Agents, and its MCP Server, allowing SaaS companies to bring conversational and agentic analytics into their products while keeping those interactions tied to governed analytics and existing permissions.
For a broader look at software options in this category, explore our review of top conversational analytics tools.


Why Embedded Data Experiences Matter for SaaS Products
Embedded analytics makes product data useful at the point of decision, giving customers a direct way to monitor perforYou can use an embedded analytics platform mance, explore questions, and act on insights without leaving their workflow. These embedded data experiences can also strengthen the value of the product while reducing the recurring dashboard, reporting, and analytics requests that consume product and engineering time.
| Why it matters | How embedded analytics creates value |
|---|---|
| Keeps insights inside the customer workflow | Dashboards, contextual metrics, reports, and AI-generated answers appear where customers already work, reducing the need to export data or switch to a separate analytics tool. |
| Gives customers more control | Self-service analytics lets users filter, personalize, explore, and create their own views within product-defined data models and permissions instead of relying on the SaaS team for every new request. |
| Reduces the analytics feature backlog | Reusable dashboards, report builders, self-service tools, alerts, and workflows can reduce recurring requests that would otherwise consume product and engineering roadmap capacity. |
| Makes the product more useful and differentiated | Customer-facing analytics becomes part of the product’s value proposition rather than an add-on reporting function, giving users more reasons to rely on the application for everyday decisions. This can support stronger adoption, retention, and competitive differentiation. |
| Creates opportunities to monetize analytics | SaaS platforms can package advanced analytics, reporting, self-service, or AI capabilities into premium tiers or higher-value product offerings rather than treating analytics purely as a cost center. |
| Turns insights into action | Alerts and automated workflows can respond when defined conditions change, helping users move from noticing a problem to starting the appropriate action without constantly monitoring a dashboard. |
| Makes AI useful in context | Conversational analytics and agents can answer questions, generate visualizations, and support workflows using the same governed datasets, metadata, permissions, and tenant context as the rest of the product experience. |
| Avoids making analytics a permanent engineering project | An embedded analytics platform can provide the data, visualization, security, self-service, automation, and AI layers that SaaS teams would otherwise need to build and maintain themselves. Qrvey is purpose-built around this model for multi-tenant SaaS. |
What Makes Embedded Data Hard in Multi-Tenant SaaS?
The challenge is not simply putting analytics inside the product. Embedded analytics has to stay secure, consistent, fast, and native to the application even as tenants, users, datasets, and customer requirements grow.

- Keeping every tenant’s data isolated: The analytics layer must apply the correct tenant, role, record, column, and entitlement rules to every request so customers only see the data they are authorized to access.
- Maintaining trusted metrics and governance: Dashboards, reports, self-service analytics, and AI-generated answers need to use the same governed definitions, calculations, metadata, and business logic to avoid conflicting results.
- Managing query performance and cloud costs: Interactive dashboards, ad hoc analysis, reports, and AI requests can create heavy concurrent workloads. The architecture needs to keep response times predictable without placing unnecessary load on operational databases or data warehouses.
- Preserving a native, white-labeled product experience: Analytics should match the application’s branding, navigation, permissions, and workflows rather than feeling like a separate tool embedded inside it.
Embedded Data Examples and Use Cases
Let’s look at a few real-world examples and common use cases of how embedded analytics turns product data into useful in-app experiences.
1. EvenFlow: Dealership Analytics and Automated Recall Reporting
EvenFlow uses Qrvey to bring dealership data that was previously accessible mainly through developers, Excel, or Python directly into its product. Dealership customers can now explore operational metrics through multi-tenant dashboards, while internal teams can investigate customer issues without relying on engineering for every query.
The company also uses analytics to drive action. Its Daily Recall Report pulls VIN-based recall data, creates a report for each dealership, and delivers it to parts managers before scheduled service appointments.
“Qrvey democratizes insight and data in a way our customers, and even we internally, never had before. It’s an immensely powerful tool embedded in our day-to-day operations.” — David Anderson, CEO, EvenFlow.ai
2. JobNimbus: Self-Service Analytics for Contractor Customers
JobNimbus needed to replace inflexible legacy reporting that was contributing to churn among some larger customers. With Qrvey embedded into its CRM and project management platform, customers can build and customize reports and dashboards without waiting for JobNimbus to develop each view for them.
Flexible data modeling brings insights together across disparate sources, while governance controls keep self-service manageable. Within months of deployment,
JobNimbus reported 70% adoption among targeted large enterprise users, alongside reduced churn related to reporting limitations and more streamlined product development.
“We can’t speak highly enough of the stellar team at Qrvey; their dedication is something we truly value”. – Ryan Quackenbush, Senior Product Manager at JobNimbus
3. Impexium: Modern Self-Service Analytics for Association Management
mpexium wanted to modernize its legacy analytics while giving association customers more control over their own reporting. Previously, the team had to create charts, dashboards, reports, and metrics on an ad hoc basis whenever customers needed new analysis.
Qrvey allowed Impexium to embed self-service analytics, data collection, and automation into its association management platform. Customers can build their own forms and analytics, while event feedback, survey responses, and other data can feed directly into analytical experiences.
As CTO Dadou Jahanbani put it, “Qrvey allowed Impexium to go to market quickly and get analytics into the hands of our customers.”
4. SaaS Performance and Usage Analytics

A SaaS product can surface metrics such as MRR, churn, revenue, active users, API usage, or storage directly inside the product. Embedded analytics lets users filter results, compare periods, drill into changes, and investigate what is driving performance. Dashboards can also be personalized by role, account, or customer.
5. Customer Support Analytics

Support teams can use embedded analytics to track tickets resolved, response times, CSAT, channel activity, and other service metrics directly within their workflow. Managers can compare trends, identify rising support demand, and spot performance issues without switching tools. Alerts and workflows can also flag metrics that cross defined thresholds.
How to Implement Embedded Data Experiences: Build vs Buy
There are three practical ways to deliver embedded analytics inside a product: build the analytics layer yourself, embed an existing BI tool, or use a platform designed specifically for embedded analytics. The right choice depends on how much control you need, how quickly you need to ship, and how much engineering capacity you want to commit after launch.
1. Build the Analytics Experience In-House
Building in-house gives you complete control, but it also means taking responsibility for far more than charts and dashboards. The team has to build and maintain data preparation, tenant security, permissions, reporting, self-service capabilities, exports, performance optimization, alerts, and the infrastructure underneath them.
This route can make sense when analytics is highly specialized, central to the product’s intellectual property, or difficult to support with existing platforms. For most teams, however, the bigger question is whether owning all of that infrastructure is worth the engineering time, maintenance burden, and slower delivery of core product features.
Those costs continue after launch as datasets grow, customer requirements change, and new analytics capabilities are requested. Qrvey’s Build vs. Buy ROI Calculator can help put a number on that decision by comparing engineering headcount, warehouse costs, supporting tools, licensing, and potential revenue over a three-year period.
2. Embed an Existing BI Tool
Traditional BI platforms can be a good fit when teams already use them internally and only need standardized dashboards or reports embedded into the product.
They are usually faster than building from scratch because core and reporting capabilities already exist. However, limitations appear as requirements become more product-specific.
Tenant-aware security, white-labeling, external self-service, licensing at scale, and deeper application integration can require significant customization, reducing the advantage over a purpose-built embedded analytics platform.
3. Use an Embedded Analytics Platform
A purpose-built embedded analytics platform sits between building the entire stack yourself and adapting a general-purpose BI product. These platforms are designed to supply reusable analytics capabilities such as data preparation, dashboards, reporting, self-service, security, AI, and workflow automation while still allowing the experience to live inside the host application.

Qrvey is one option in this category. It provides native multi-tenant security across the data and analytics layers and supports self-hosting within your AWS or Azure environment. It also uses flat-rate licensing rather than charging separately for every tenant or user.
That model is designed to support customer-facing analytics as usage expands without requiring teams to build the complete analytics infrastructure themselves.

Deliver Secure Embedded Data Experiences With Qrvey

The result is faster delivery, stronger governance, lower maintenance, and an analytics experience that feels native to your product. Qrvey is best suited to SaaS teams that need secure, scalable analytics across multiple customers without building the entire analytics layer themselves.
Book a demo to see how Qrvey can fit your product.
FAQs
Yes. A dashboard can combine live data for current activity with cached or warehouse-backed data for historical analysis, so different visualizations can use the source that best fits their freshness and performance requirements.
Yes. Users can adjust charts, filters, and layouts and save those changes as personal views that persist between sessions while the original governed dashboard remains unchanged.
Teams can maintain a reusable dashboard and deploy it across tenant workspaces while applying tenant-specific permissions and access rules. This avoids rebuilding and manually maintaining a separate copy for every customer.
Yes. A multi-tenant analytics architecture can use commingled datasets for shared benchmarks alongside isolated datasets for customer-specific metrics, provided the appropriate access controls are enforced.
Yes. Qrvey supports role-based dashboards for matching tenant users and end-user personalization that preserves each user’s customized dashboard view across sessions.
David is the Chief Technology Officer at Qrvey, the leading provider of embedded analytics software for B2B SaaS companies. With extensive experience in software development and a passion for innovation, David plays a pivotal role in helping companies successfully transition from traditional reporting features to highly customizable analytics experiences that delight SaaS end-users.
Drawing from his deep technical expertise and industry insights, David leads Qrvey’s engineering team in developing cutting-edge analytics solutions that empower product teams to seamlessly integrate robust data visualizations and interactive dashboards into their applications. His commitment to staying ahead of the curve ensures that Qrvey’s platform continuously evolves to meet the ever-changing needs of the SaaS industry.
David shares his wealth of knowledge and best practices on topics related to embedded analytics, data visualization, and the technical considerations involved in building data-driven SaaS products.