Dashboard Reporting Tools: 11 Best Picks for 2026 by Use Case
 Natan Cohen··51 min read

⚡Key Takeaways
- Qrvey stands out for multi-tenant SaaS teams that need customer-facing dashboards, self-service reporting, pixel-perfect reports, tenant-aware security, governed AI, workflow automation, and flat-rate licensing.
- Microsoft Power BI, Tableau, and Looker suit different enterprise BI needs: Power BI fits Microsoft-centric teams, Tableau emphasizes advanced visual analysis, and Looker supports consistent reporting through governed data models.
- Domo, Sigma, and ThoughtSpot offer distinct approaches to business reporting: Domo combines data integration and workflows, Sigma provides spreadsheet-style warehouse analysis, and ThoughtSpot focuses on search and conversational exploration.
- GoodData, Sisense, Metabase, and Zoho Analytics address different implementation priorities: GoodData emphasizes governed analytics across workspaces, Sisense supports customizable embedded experiences, and Metabase and Zoho Analytics offer approachable reporting for smaller teams and budgets.
The best dashboard reporting tool depends less on how many chart types it offers and more on who needs the dashboard, what they need to do with it, and where that experience needs to live.
Some platforms excel at internal BI. Others are better for customer-facing SaaS analytics, self-service reporting, highly customized embedded experiences, or operational dashboards.
This guide compares the leading 11 dashboard reporting tools for 2026 by use case, including their standout capabilities, pricing, and where each one fits best.
| Platform | Best For | Standout Capability | Pricing |
|---|---|---|---|
| Qrvey | Customer-facing dashboard reporting in multi-tenant SaaS | Embedded dashboards, self-service creation, pixel-perfect reporting, scheduled reporting, tenant-aware security, and native JavaScript embedding in one platform | Flat-rate pricing; custom quote |
| Microsoft Power BI | Microsoft-centric teams needing affordable dashboard reporting | Power Query, DAX, semantic models, interactive dashboards, and deep Microsoft 365/Fabric integration | Free; Pro $14/user/month; Premium Per User $24/user/month; Embedded usage-based |
| Tableau | Advanced data visualization and interactive dashboard reporting | Highly flexible visual analytics with advanced charting, calculated fields, LOD expressions, and Tableau Pulse | Cloud Standard from $15/user/month; Enterprise from $35/user/month; Cloud+ custom |
| Looker | Governed dashboard reporting on Google Cloud | LookML semantic layer for centrally managed metrics and consistent reporting | Custom annual quote |
| Domo | End-to-end dashboard reporting with data integration and automation | Combines data connectors, Magic ETL, dashboarding, reporting, automation, and analytical applications | 30-day free trial; production pricing custom and credit-based |
| Sigma | Spreadsheet-style dashboard reporting on cloud data warehouses | Familiar spreadsheet interface over live warehouse data with self-service analytics and writeback | Custom quote |
| ThoughtSpot | AI-powered search and self-service dashboard reporting | Spotter AI Agent and search-driven analytics for exploring questions beyond predefined dashboards | Essentials from $25/user/month; Pro from $50/user/month; Enterprise custom |
| GoodData | Governed dashboard reporting across multiple teams and customers | Centralized semantic layer with multi-tenant workspaces, governed self-service, and analytics-as-code | Custom quote; Professional uses platform + workspace pricing |
| Sisense | Customizable dashboard reporting and embedded analytics | Flexible SDKs and embedding options with live data, ElastiCube modeling, and multi-tenant configurations | Contact sales; Enterprise custom |
| Metabase | Simple, affordable dashboard reporting and self-service BI | Accessible no-code query building alongside SQL-based reporting | Open Source free; Starter from $100/month; Pro from $575/month; Enterprise custom |
| Zoho Analytics | SMBs needing affordable dashboard reporting and automated insights | Drag-and-drop reporting with Ask Zia, automated distribution, data preparation, and Zoho ecosystem integration | Free; paid plans from $24/month |
1. Qrvey: Best for Customer-Facing Dashboard Reporting in Multi-Tenant SaaS

Qrvey is an embedded analytics platform purpose-built for B2B SaaS companies that need to deliver dashboards, reports, and self-service analytics directly to customers across multiple tenants.
It combines interactive dashboarding, pixel-perfect reporting, data management, multi-tenant security, JavaScript embedding, automation, and governed AI within the same analytics layer.
That makes Qrvey particularly strong when reporting is part of the SaaS product rather than an internal BI function.
Product teams can provide predefined dashboards for everyday users, deeper self-service creation for power users, and highly formatted operational reports for workflows where a dashboard alone is not enough.
Those experiences remain connected to the application’s existing data, permissions, tenant structure, and branding.
Key Features
1. Embedded Dashboards and Self-Service Dashboard Building
Qrvey supports both predefined dashboards and deeper self-service creation, allowing SaaS teams to decide how much control different users should have.
Everyday users can work with governed dashboards, filters, drilldowns, and personalized views, while power users can create, save, and share their own dashboards from the datasets and visualization options the product team makes available.

The dashboard builder itself can also be embedded directly into the SaaS application, so advanced reporting does not require customers to move into a separate BI product.
Dashboards remain governed by the product’s multi-tenant security, role-based permissions, and defined metrics, even when customers create their own reports.
At JobNimbus, inflexible reporting had contributed to churn among some larger customers, prompting the company to introduce more customizable self-service analytics with Qrvey.
Within months, 70% of its targeted large enterprise users adopted the new reporting experience, alongside a reduction in churn related to reporting limitations.
2. Pixel-Perfect and Scheduled Reporting
Not every reporting requirement belongs on an interactive dashboard. Finance, operations, compliance, and customer-facing workflows often need highly formatted reports where headers, footers, totals, pagination, and layout remain consistent every time the report is generated.
Qrvey supports pixel-perfect reporting alongside interactive dashboards, giving SaaS teams a way to handle structured operational reporting inside the same analytics environment.

- Designed-for-print fidelity: Create branded, print-quality reports with consistent headers, footers, pagination, totals, and formatting for use cases such as invoices, statements, compliance documents, and board packets.
- Scheduled distribution: Run reports on a defined cadence and deliver them automatically to the right recipients, reducing reliance on manual exports and repeated dashboard checks.
- Tenant-aware templates: Use a single report template while generating customer-specific outputs that remain branded and scoped to the correct tenant.
- Author once, deliver to many: Power users can create the report once, while other users simply receive the finished output without needing to build or configure it themselves.
EvenFlow.ai uses Qrvey to generate a Daily Recall Report containing VIN-based recall information for each dealership, delivering it to parts managers before service appointments.
The information arrives early enough for teams to prepare the necessary parts instead of discovering the issue after a customer arrives.

3. Native Multi-Tenant Security for Customer Reporting
Customer-facing reporting becomes more complicated when one SaaS application serves hundreds or thousands of organizations. Every dashboard, report, filter, and export needs to show the correct information for the right tenant and user.

Qrvey was designed around this multi-tenant requirement from the start. Tenant and user context can be securely passed from the host application into the analytics layer, allowing dashboards and reports to follow the application’s existing roles, permissions, and access rules rather than requiring teams to maintain a separate security model for reporting.

At CrowdChange, a fundraising software platform serving nonprofits, customer-facing analytics needed to accommodate complex account hierarchies while keeping each organization’s data separate.
With Qrvey, the team introduced predefined dashboards to selected customers and gained the flexibility to release analytics updates independently of its main application. This gave CrowdChange a more manageable foundation for expanding reporting as customer requirements evolved.
“They made it very easy to learn how handling multi-tenancy would work. The documentation and structure were simple to follow, and when we had questions, they were clarified quickly so we could just get to work and get it done. That was really important, and it was just simple to follow and understand.” – Jared Allen, VP of Partner Success and Product Development at CrowdChange
4. Built-In Data Management
Reporting quality depends on what sits underneath the dashboard. Operational SaaS data is not always structured or optimized for repeated analytical queries, especially when many tenants are accessing reports at the same time.
Qrvey’s Data Management Layer helps turn operational data into analytics-ready data through three core areas:

- Data Pipeline: Connects, synchronizes, transforms, enriches, and prepares data from databases, warehouses, APIs, files, and other sources.
- Data Lake: Stores and optimizes analytics-ready data for multi-tenant reporting and analytical workloads.
- APIs: Allow teams to manage and automate data operations programmatically and connect reporting to the broader SaaS architecture.
Together, these capabilities reduce the need to assemble separate systems for data movement, transformation, storage, and dashboard delivery.
5. Native JavaScript Embedding and White Labeling
Qrvey uses native JavaScript components to embed dashboards and reporting experiences directly into SaaS applications.
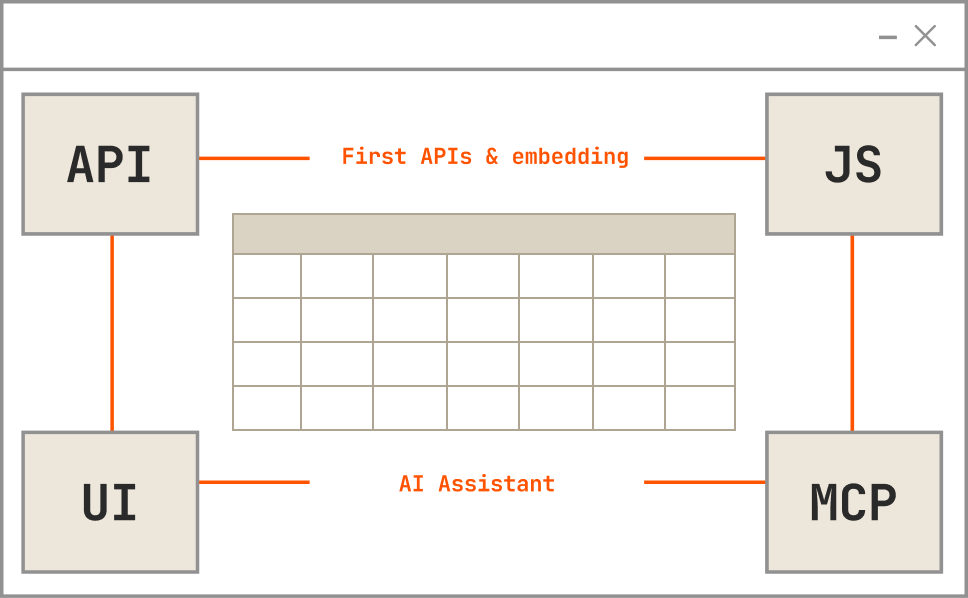
Teams can control how dashboards, charts, filters, and builders appear within the surrounding product rather than presenting customers with a separate reporting portal. Analytics can follow the application’s branding, navigation, layouts, and design system so reporting feels like part of the product itself.

White labeling also extends beyond interactive dashboards. Pixel-perfect reports and self-service authoring can remain under the SaaS company’s own product identity instead of exposing customers to a third-party analytics vendor.

6. Governed AI and Agents
Qrvey brings AI into dashboard reporting without separating it from the data, permissions, and business context already governing the analytics experience.

Qrvey Sidekick gives users a natural-language way to ask questions about their data and explore information beyond what is already shown on a dashboard.

Purpose-built agents support more focused analytical tasks: the Chart Builder Agent can turn a natural-language request into a visualization, while Smart Analyzer helps users investigate existing charts and understand what the data is showing.
Teams can also create Custom Agents around their own terminology, business logic, customer roles, and use cases.


The Qrvey MCP Server connects these AI experiences to datasets, dashboards, metadata, and tenant-aware permissions, helping AI stay aligned with the same governed analytics environment used throughout the application.

7. AI-Powered Workflow Automation
Qrvey can also connect reporting to the actions that should happen next. Teams can define workflows around analytics events, thresholds, status changes, or other operational conditions and automatically trigger the appropriate response.

For example, a change in a reporting metric could trigger an alert, notify the right user, escalate an issue, update another system, or start a downstream process. This reduces the need for users to spot something in a dashboard and then manually recreate the next step in email, tickets, spreadsheets, or another application.

By bringing reporting and workflow automation together, SaaS teams can shorten the path from data signal to action while reducing the amount of custom workflow logic engineering has to build and maintain.
Qrvey Pricing
Qrvey uses flat-rate licensing built for SaaS companies rather than charging per user, tenant, or data usage. Both Qrvey Pro and Qrvey Ultra follow a predictable flat-rate model with no unexpected add-ons, giving teams more cost certainty as their customer base, dashboard usage, and reporting requirements grow.
| Plan | Best for | What it includes |
|---|---|---|
| Qrvey Pro | SaaS teams with an analytics-ready database that want to move quickly and keep infrastructure light | Fast, cost-effective deployment of embedded dashboards, reporting, and automation without the overhead of a data engine |
| Qrvey Ultra | SaaS teams seeking maximum flexibility, scalability, and control in one platform | Built-in data engine and transformation layer for high-performance, multi-tenant analytics from any data source |

Where Qrvey Shines
- Covers dashboards and operational reporting in one platform: Teams can combine interactive dashboards, self-service creation, pixel-perfect documents, and scheduled reporting rather than introducing a separate solution whenever reporting requirements move beyond visualization.
- Reduces reporting development work: Qrvey can deliver an embedded analytics layer up to 10× faster than building equivalent functionality in-house. Self-service reporting also lets customers answer more questions independently, without sending every new dashboard request back to engineering.
- Built for customer-facing multi-tenancy: Reporting remains tied to tenant context, user permissions, and governed data, making Qrvey a better fit for SaaS products than tools primarily designed for one company’s internal reporting.
- Keeps reporting under the product’s brand: JavaScript embedding and white labeling help dashboards, report builders, and formatted reports feel like native product capabilities instead of a third-party BI experience.
- Supports reporting needs as the product grows: Teams can start with predefined dashboards and expand into self-service, pixel-perfect reporting, scheduled reports, workflow automation, and AI-assisted analytics without rebuilding the reporting layer around separate tools.
Where Qrvey Falls Short
- Less relevant for single-tenant applications: If reporting only needs to serve one organization and does not require tenant-aware access or customer-specific experiences, Qrvey’s multi-tenant architecture may be unnecessary.
Qrvey Customer Reviews
“Qrvey allowed Impexium to go to market quickly and get analytics into the hands of our customers.” – Dadou Jahanbani Chief Technology Officer at Impexium
“The flexibility and ease of use with Qrvey’s platform allows us to satisfy any use case that our customers ask for. They are blown away all the time when we say “Sure, we can support this request. We will have this ready for you later today.” That directly helps our customers run more efficiently and deliver a better experience — so nothing falls through the cracks.” – David Anderson, CEO of EvenFlow.ai
Who Qrvey Is Best For
- Multi-tenant B2B SaaS companies: A strong fit when dashboards and reports need to be delivered securely across many customer accounts, roles, and datasets.
- SaaS products that need more than dashboards: Particularly useful when reporting requirements include self-service dashboard creation, scheduled operational reports, and pixel-perfect outputs.
- Product and engineering teams reducing reporting requests: Well suited to teams that want customers to answer more questions themselves instead of continually requesting new dashboards, exports, and custom reports.
- Companies treating reporting as part of the product experience: Best when analytics needs to match the application’s branding, permissions, workflows, and customer experience rather than existing as a separate reporting tool.
- Teams with expanding reporting requirements: Useful when today’s dashboards are likely to grow into deeper self-service, automated delivery, workflows, and AI-assisted analysis over time.
2. Microsoft Power BI: Best for Microsoft-Centric Teams Needing Affordable Dashboard Reporting

Microsoft Power BI is a business intelligence and reporting platform that helps organizations connect data from multiple sources, create interactive dashboards, and distribute reports across departments. It combines visual report building with Power Query for data preparation, DAX for calculations, and semantic models for managing business metrics.
Power BI is particularly useful for companies already using Excel, Microsoft 365, Azure, and Microsoft Fabric. Teams can automate recurring reporting, build detailed performance dashboards, and share insights through familiar Microsoft applications without introducing an entirely separate analytics ecosystem.
Key Features
- Interactive dashboard builder: Create reports with charts, KPI cards, tables, maps, slicers, and drill-down interactions using a drag-and-drop interface.
- Power Query data preparation: Connect, clean, merge, and transform data from spreadsheets, databases, cloud services, and APIs before building reports.
- DAX calculations and semantic models: Define measures, calculated columns, relationships, and reusable business metrics for more sophisticated reporting.
- Automated refresh and scheduled reporting: Keep reports updated through scheduled dataset refreshes and distribute insights through subscriptions and alerts.
- Copilot-powered report creation: Use natural-language prompts to generate report pages, visualizations, DAX expressions, and analytical summaries with eligible capacity and licensing.
- Microsoft ecosystem integration: Connect reporting workflows with Excel, Teams, SharePoint, Azure, and Microsoft Fabric.
Pricing
| Plan | Pricing | Notes |
|---|---|---|
| Free | Free | Create reports; paid licensing is required for normal publishing and sharing scenarios. |
| Power BI Pro | $14/user/month | Publish and share Power BI reports. |
| Premium Per User | $24/user/month | Includes Pro plus larger models, more frequent refreshes, and additional enterprise functionality. |
| Power BI Embedded | Variable | Usage-based embedded analytics pricing. |
Power BI offers a low entry price for conventional reporting, but organizations should consider additional costs for Microsoft Fabric capacity, advanced workloads, and Copilot. A Power BI Pro subscription alone does not provide every premium AI capability.
Where Microsoft Power BI Shines
- Making reporting accessible to Microsoft users: Familiarity with Excel, Microsoft 365, and other Microsoft services can make Power BI easier to adopt.
- Combining data preparation and reporting: Power Query, semantic models, and visual reports reduce the need to assemble separate tools for routine analytical workflows.
- Automating recurring business reports: Scheduled refreshes, shared dashboards, and subscriptions help teams replace repetitive spreadsheet reporting.
- Providing strong functionality at an accessible starting price: Its per-user plans make it approachable for smaller teams that need enterprise-grade reporting capabilities.
Where Microsoft Power BI Falls Short
- Advanced data modeling requires expertise: DAX, relationships, complex measures, and performance optimization can become challenging for less technical users.
- Large datasets can affect performance: Complex reports and inefficient models may require additional optimization or higher-capacity infrastructure.
- Power BI Desktop is Windows-centric: Teams relying heavily on macOS may need alternative workflows for advanced report authoring.
- Licensing can become complicated: Pro, Premium Per User, Fabric capacity, embedded capacity, and Copilot requirements create additional purchasing decisions as reporting needs grow.
Customer Reviews
“What I like most is its ability to quickly turn raw data into clear, interactive dashboards. It integrates smoothly with multiple data sources.” – Abhishek B., System Engineer.
“The visuals are intuitive, and connecting data from different sources is quite smooth.” – Verified User, Small Business.
Who Microsoft Power BI Is Best For
- Microsoft-centric businesses: Particularly suitable when teams already use Excel, Azure, Microsoft 365, and Microsoft Fabric.
- Finance, operations, and business reporting teams: Best when organizations need affordable interactive dashboards, recurring KPI reporting, and centralized business metrics.

3. Tableau: Best for Advanced Data Visualization and Interactive Dashboard Reporting

Tableau is a visual analytics and business intelligence platform designed to help organizations turn complex datasets into interactive dashboards, reports, and visual stories. Its drag-and-drop authoring environment allows analysts to explore relationships, build custom calculations, and present data through a wide range of chart types.
Tableau is particularly strong when reporting requires more than standard KPI tables and charts. Analysts can create detailed exploratory dashboards while business users interact with filters, drilldowns, and customized views. Tableau Pulse also adds automated metric monitoring and personalized insights, extending the platform beyond conventional dashboard consumption.
Key Features
- Advanced visualization builder: Create interactive dashboards with charts, maps, tables, scatter plots, parameters, and custom visualizations.
- Drag-and-drop analytical exploration: Investigate datasets visually without writing SQL for every query or chart.
- Calculated fields and LOD expressions: Develop complex measures, aggregations, and analytical calculations for specialized reporting requirements.
- Tableau Pulse: Monitor governed metrics and automatically surface changes, trends, and personalized explanations.
- Data preparation and connectivity: Connect to spreadsheets, databases, warehouses, and cloud systems, with Tableau Prep supporting cleaning and transformation workflows.
- Automated reporting and collaboration: Publish dashboards, schedule subscriptions, configure alerts, and distribute analytical content through Tableau Cloud or Tableau Server.
Pricing
| Plan | Pricing | Notes |
|---|---|---|
| Tableau Standard | Viewer $15; Explorer $42; Creator $75/user/month | Billed annually; includes Tableau Pulse. |
| Tableau Enterprise | Viewer $35; Explorer $70; Creator $115/user/month | Adds Data Management and Advanced Management capabilities. |
| Tableau Cloud+ | Custom quote | Adds premium agentic analytics capabilities, including Tableau Agent across additional experiences. |
| Tableau+ Bundle | Custom quote | Combines Tableau Cloud+ and Tableau Next. |
Tableau Pulse is included with Tableau Cloud editions, but several more advanced AI capabilities are reserved for Cloud+ and Tableau+ offerings.
Where Tableau Shines
- Creating sophisticated visual reports: Tableau offers substantial flexibility for analysts building interactive dashboards, custom charts, and detailed data stories.
- Supporting exploratory analysis: Users can investigate trends and relationships beyond the original reporting question through filters, calculations, and visual interactions.
- Communicating complex findings: Rich visualizations make Tableau particularly useful when reporting must explain business performance to different audiences.
- Combining scheduled and proactive insights: Dashboards, subscriptions, alerts, and Tableau Pulse offer different ways to distribute analytical findings.
Where Tableau Falls Short
- Advanced authoring has a learning curve: Complex calculations, LOD expressions, data modeling, and dashboard optimization require additional training.
- Creator licensing increases costs: Organizations with many employees developing reports should account for higher-priced authoring licenses.
- Complex dashboards need performance planning: Large datasets, numerous calculations, and demanding visualizations may require optimization.
- Premium AI features are not included in every edition: Organizations seeking Tableau Agent’s broader capabilities may need Tableau Cloud+ or Tableau+.
Customer Reviews
“Tableau makes it easy to turn complex data into clear, interactive dashboards and visual reports. I really appreciate how flexible the visualizations are.” – Verified Enterprise User in Consumer Goods.
“What I like most about Tableau is how intuitive and visually engaging it is. Even with limited use, I found it relatively easy to create clear and interactive dashboards.” – Verified Tableau User.
Who Tableau Is Best For
- Data analysts and BI teams: Particularly suitable when teams need advanced charting, custom calculations, and exploratory dashboard design.
- Enterprises prioritizing data storytelling: Best when interactive visuals and detailed analytical presentations are central to reporting requirements.
4. Looker: Best for Governed Dashboard Reporting on Google Cloud

Looker is an enterprise business intelligence platform from Google Cloud that helps organizations create dashboards, reports, and self-service analytical experiences using centrally defined business metrics. Its core capability is LookML, a semantic modeling language that allows data teams to define relationships, calculations, dimensions, and measures before distributing reports to users.
For this comparison, Looker refers to Looker (Google Cloud core) rather than the lighter Looker Studio product. Looker is particularly useful when reporting consistency and data governance matter across multiple departments. Organizations can create reusable analytical models and build dashboards on top of those definitions rather than maintaining separate business logic in every report.
Key Features
- LookML semantic modeling: Establish reusable business metrics, dimensions, joins, and calculations that provide consistent definitions across dashboards.
- Interactive dashboard builder: Create reports using tiles, charts, tables, filters, drilldowns, and customized analytical views.
- Looker Explores: Allow authorized users to investigate governed datasets and build reports without writing SQL for every question.
- Scheduled report delivery: Distribute dashboards and reports through email or supported delivery destinations on recurring schedules.
- Gemini-powered conversational analytics: Support natural-language analytical questions and AI-assisted exploration through eligible Gemini in Looker capabilities.
- APIs and embedded reporting: Integrate analytics into external applications and automate content management, permissions, and other reporting operations.
Pricing
| Plan | Pricing | Notes |
|---|---|---|
| Standard | Custom annual quote | Designed for smaller organizations or teams with fewer than 50 users; includes 10 Standard Users and 2 Developer Users. |
| Enterprise | Custom annual quote | Adds enhanced security and considerably higher API allowances for larger internal analytics deployments. |
| Embed | Custom annual quote | Designed for external analytics and custom applications, with higher API allowances for embedded deployments. |
Looker pricing has two main components: the platform subscription and individual user licenses. Google does not publish fixed annual prices for Standard, Enterprise, or Embed, so organizations need to contact sales for an exact quote. Looker subscriptions also include monthly data-token allocations for Conversational Analytics, with allowances varying by platform tier.
Where Looker Shines
- Maintaining consistent reporting metrics: LookML allows organizations to define KPIs centrally so teams do not calculate the same business metric differently.
- Supporting governed self-service: Business users can explore data through predefined models without needing unrestricted access to raw database structures.
- Integrating with Google Cloud: Looker works particularly well for organizations already using BigQuery and other Google Cloud data services.
- Distributing analytics across teams: Centralized models, dashboards, permissions, and scheduling help companies maintain reporting consistency as usage increases.
Where Looker Falls Short
- LookML requires technical expertise: Creating and maintaining semantic models generally requires data engineers or analytics developers.
- Initial implementation can take time: Teams need to prepare datasets, define relationships, and establish business metrics before rolling out comprehensive reporting.
- Visualization flexibility may require additional work: Highly specialized chart types or custom analytical interfaces can require development beyond standard dashboard configuration.
- No fixed public pricing: Organizations must contact Google Cloud sales to establish the total cost of the platform and licenses.
Customer Reviews
“It’s easy to navigate, and I can quickly find the reports and information I need. Looker has been pivotal in our organization.” – Pradeep K., Graphic Designer.
“I really like that Looker is so easy to use, making data accessible to my whole company. It’s very easily shareable with the wider team.” – Emma N., CRM Specialist.
Who Looker Is Best For
- Google Cloud and BigQuery users: Particularly suitable when reporting sits on top of an established Google Cloud data architecture.
- Enterprises prioritizing governed metrics: Best when different departments need consistent definitions, centrally managed calculations, and controlled self-service reporting.
5. Domo: Best for End-to-End Dashboard Reporting With Data Integration and Automation

Domo is a cloud-based analytics platform that brings together data integration, transformation, dashboard reporting, AI-powered insights, and workflow automation. Instead of focusing only on creating charts, Domo provides a broader environment for preparing data, building analytical applications, distributing reports, and monitoring business performance.
Its combination of connectors, Magic ETL, visualization tools, and automated reporting makes Domo particularly relevant for organizations pulling information from many operational systems. Teams can consolidate disparate data, create dashboards for different departments, and automate reporting workflows without maintaining separate tools for every stage.
Key Features
- Interactive dashboard builder: Create KPI dashboards, charts, tables, filters, and interactive reports through Domo’s visualization environment.
- Broad data connectivity: Connect to cloud applications, databases, spreadsheets, and other operational systems using prebuilt connectors.
- Magic ETL: Clean, join, transform, and prepare datasets through a visual data transformation interface.
- Scheduled reports and alerts: Automatically deliver reports and notify users when business metrics meet defined conditions.
- App Studio: Create customized analytical applications and interactive workflows using Domo data and visualization capabilities.
- Domo AI and automation: Use AI-powered analytical capabilities, natural-language interactions, agents, and workflow automation to extend reporting into operational decisions.
Pricing
Domo uses credit-based consumption pricing with unlimited users and no fixed published production price. It offers a 30-day free trial of the broader platform, while ongoing costs depend on credit-consuming activities such as data updates, storage, workflows, and advanced processing. Organizations should estimate those activities alongside their reporting requirements when requesting a production quote.
Where Domo Shines
- Consolidating data and reporting: Organizations can connect sources, prepare datasets, and create dashboards without switching between several disconnected tools.
- Reducing manual reporting: Magic ETL, scheduled reports, and alerts help automate recurring data preparation and distribution.
- Supporting organization-wide analytics: Domo’s unlimited-user pricing model allows broad reporting access without charging for every additional seat.
- Connecting dashboards to actions: App Studio, automation, and AI capabilities let teams build workflows around analytical findings.
Where Domo Falls Short
- Consumption costs require monitoring: Organizations need to understand which activities consume credits and how usage may increase over time.
- The platform can be more extensive than necessary: Teams seeking only lightweight dashboard reporting may not need Domo’s broader data integration and application development capabilities.
- Advanced functionality requires training: Complex transformations, analytical applications, and automation can introduce additional implementation work.
- No published fixed production price: Buyers need a quote and estimated workload profile to evaluate costs accurately.
Customer Reviews
“I love how easy it is to use and learn. It has been really valuable because if Domo doesn’t natively have a visualization I’m looking for, I can build a custom one.” – Andrew P., BI Analyst.
“I use Domo as an interface to provide analytics for my company as well as the advisers I work for. I appreciate the availability of Domo to assist and provide cutting-edge solutions.” – Verified User, Small Business.
Who Domo Is Best For
- Organizations managing multiple data sources: Particularly useful when reporting depends on combining CRM, finance, marketing, and operational systems.
- Teams wanting an end-to-end analytics environment: Best when data integration, dashboard creation, automated reports, and workflows should be delivered through one platform.

6. Sigma: Best for Spreadsheet-Style Dashboard Reporting on Cloud Data Warehouses

Sigma is a cloud analytics and reporting platform that allows users to explore live warehouse data through a spreadsheet-like interface. It combines familiar tables, formulas, and calculations with interactive dashboards and business intelligence capabilities, making large datasets more accessible to teams that do not regularly write SQL.
Unlike reporting platforms that depend primarily on extracted datasets, Sigma works directly with supported cloud data warehouses. Business users can build dashboards and analyze information through a familiar interface, while data teams retain control over the underlying data, permissions, and warehouse infrastructure.
Key Features
- Spreadsheet-style report builder: Create analytical tables, formulas, calculated fields, and reports through a familiar spreadsheet interface.
- Interactive dashboards: Build visualizations, KPI reports, filters, drilldowns, and reusable analytical workbooks.
- Live warehouse connectivity: Query supported data warehouses, including Snowflake, BigQuery, and Databricks, without relying primarily on extracts.
- Self-service analytical exploration: Allow authorized users to investigate datasets, create calculations, and answer reporting questions without SQL.
- AI-assisted analytics: Use conversational analytics and AI-powered functions to support analytical exploration, summaries, and reporting.
- Input tables and data applications: Build interactive applications that allow users to enter or update information through controlled writeback workflows.
Pricing
| License | Pricing | Notes |
|---|---|---|
| View | Custom quote | Consumption-focused access. |
| Act | Custom quote | Adds interactive and application-oriented capabilities. |
| Analyze | Custom quote | Designed for deeper self-service analysis. |
| Build | Custom quote | Full creation and development capabilities. |
Sigma does not publish fixed prices for its licensing tiers. Organizations should also account for the cost of the connected data warehouse, since analytical activity can consume additional warehouse compute resources.
Where Sigma Shines
- Making reporting familiar to spreadsheet users: Teams can build reports and investigate information using formulas and table interactions without learning an entirely new analytical approach.
- Keeping reports connected to live data: Sigma reduces reliance on separate data extracts by querying supported warehouses directly.
- Supporting business-user self-service: Non-technical users can create calculations, customize reports, and explore governed data without submitting every request to analysts.
- Extending reporting into operational workflows: Input tables and actions enable applications that let users work with information rather than simply view it.
Where Sigma Falls Short
- Requires a supported cloud data warehouse: Organizations without modern cloud data infrastructure may need additional setup before adopting Sigma.
- Warehouse compute costs remain relevant: Complex reports, frequent queries, and high concurrency can increase underlying data infrastructure consumption.
- Highly specialized visualizations may require workarounds: Sigma prioritizes spreadsheet-style interaction and analytical flexibility over the extensive visual design capabilities of Tableau.
- No transparent public pricing: Buyers need to request a quote to determine licensing costs for different reporting users.
Customer Reviews
“It’s honestly the easiest BI tool I’ve used. Feels like a spreadsheet but it’s pulling live data straight from Snowflake, no extracts, no stale data.” – Keerthan P., Associate Data Analyst.
“What I like most about Sigma is how well the tool works. It’s very easy to learn, use, and implement.” – Verified Enterprise User in Insurance.
Who Sigma Is Best For
- Companies using cloud data warehouses: Particularly strong when reporting relies on Snowflake, BigQuery, Databricks, or similar supported infrastructure.
- Spreadsheet-oriented business teams: Best when users need flexible dashboard reporting and self-service analysis without learning SQL.
7. ThoughtSpot: Best for AI-Powered Search and Self-Service Dashboard Reporting

ThoughtSpot is an AI-powered analytics platform that combines interactive dashboards with natural-language search and conversational data exploration. Its central approach is to let users ask questions about business information directly, rather than requiring analysts to design a separate dashboard for every reporting request.
ThoughtSpot’s Spotter AI Agent extends this approach by helping users investigate trends, generate analytical answers, and explore follow-up questions. Its Liveboards provide interactive dashboards for monitoring recurring metrics, while search-driven analytics supports ad-hoc questions that fall outside predefined reporting views.
Key Features
- Spotter AI Agent: Let users ask analytical questions in natural language and receive answers, explanations, and visualizations.
- Search-driven analytics: Explore data through text-based searches instead of constructing SQL queries or creating every report manually.
- Interactive Liveboards: Build dashboards with charts, KPI visualizations, filters, and interactive analytical views.
- AI-powered insights: Surface trends, relationships, and analytical findings using AI-assisted exploration.
- Governed semantic modeling: Use defined business metrics and analytical relationships to support consistent reporting.
- Embedded reporting and APIs: Integrate dashboards, natural-language search, and AI-powered analytics into external applications.
Pricing
| Plan | Pricing | Notes |
|---|---|---|
| Developer | Free | Up to 10 users for embedded development |
| Essentials | From $25/user/month (annual billing) | Small teams |
| Pro | From $50/user/month (annual billing) | AI-powered analytics and search |
| Enterprise | Custom | Large organizations and embedded deployments |
ThoughtSpot offers user-based and consumption-based pricing options. Buyers should evaluate expected dashboard use, natural-language queries, analytical activity, and user counts when choosing the appropriate plan.
Where ThoughtSpot Shines
- Answering questions beyond predefined dashboards: Users can search for information and investigate new questions without waiting for analysts to build additional reports.
- Making analytics accessible to non-technical teams: Natural-language search lowers the barrier for employees unfamiliar with SQL or traditional BI tools.
- Combining dashboards with conversational exploration: Liveboards support routine KPI monitoring while Spotter enables more flexible analytical investigation.
- Supporting AI-driven self-service: Organizations can expand analytical access while grounding questions in governed metrics and models.
Where ThoughtSpot Falls Short
- Advanced data modeling requires expertise: Teams need to prepare datasets and define relevant business relationships before natural-language reporting works consistently.
- Visual customization may be less extensive: Organizations prioritizing highly specialized dashboard layouts and chart design may prefer visualization-first platforms.
- User adoption still requires guidance: Business users need to understand the available metrics and how to ask useful analytical questions.
- Costs depend on adoption and usage: Consumption-based plans require consideration of queries, dashboard interactions, and other billable activity.
Customer Reviews
“Easy to use. The support team is always approachable and very helpful.” – Verified User in Market Research.
“I love ThoughtSpot’s UI the most. I always say it is like the Apple of BI tools.” – Verified User in Information Technology and Services.
Who ThoughtSpot Is Best For
- Business teams prioritizing conversational reporting: Particularly suitable when users need answers beyond standard dashboard views.
- Organizations expanding self-service analytics: Best when natural-language search and AI-assisted exploration are central to the reporting experience.
8. GoodData: Best for Governed Dashboard Reporting Across Multiple Teams and Customers

GoodData is an enterprise analytics and reporting platform that combines interactive dashboards, a centralized semantic layer, self-service analytics, and multi-tenant reporting. It helps organizations establish consistent metric definitions and distribute governed reports across departments, business units, or customer accounts.
GoodData is particularly suitable when reporting consistency matters as much as dashboard design. Data teams can define metrics and relationships centrally, while business users create dashboards and explore approved datasets. Its workspace architecture also makes it useful for SaaS companies delivering customer-facing reports across multiple tenants.
Key Features
- Interactive dashboard builder: Create reports with charts, tables, KPIs, filters, and drill-down capabilities.
- Centralized semantic layer: Define reusable metrics, dimensions, relationships, and business calculations for consistent reporting.
- Self-service analytics: Allow authorized users to build reports and explore governed datasets without creating every visualization through code.
- Scheduled report distribution: Share reporting content and automate recurring delivery through supported scheduling capabilities.
- Multi-tenant workspaces: Organize dashboards, metrics, and access permissions across different departments or customer accounts.
- Analytics-as-code and APIs: Manage analytical metadata, content, and configuration through developer workflows and programmatic interfaces.
Pricing
| Plan | Pricing | Notes |
|---|---|---|
| Professional | Contact sales | Typically structured around the platform and workspaces, with embedding, multi-tenancy, branding, and developer tooling. |
| Enterprise | Custom quote | Adds broader governance, AI, security, deployment, support, and SLA requirements. |
GoodData does not publish fixed starting prices for its current plans. Professional pricing is primarily based on the platform and number of workspaces, while Enterprise is tailored to deployment requirements.
Where GoodData Shines
- Keeping reporting metrics consistent: Centrally managed definitions help different departments produce reports based on the same business logic.
- Supporting governed self-service: Users can create and explore reports without bypassing established metric definitions or permissions.
- Distributing reports across multiple workspaces: Its hierarchical workspace architecture supports reporting for different departments and customer accounts.
- Managing reporting through development workflows: APIs and analytics-as-code capabilities help teams maintain reporting assets more systematically.
Where GoodData Falls Short
- Semantic modeling requires initial setup: Teams need to prepare datasets, relationships, and business metrics before users can take full advantage of reporting capabilities.
- Complex models require technical expertise: Advanced calculations and sophisticated data relationships may need dedicated analytics developers.
- Workspace pricing needs evaluation: Organizations distributing reporting across many workspaces should model licensing costs carefully.
- No public fixed pricing: Buyers need to contact GoodData to determine their total production cost.
Customer Reviews
“GoodData offers advanced analytics for predictive modeling. I like that it’s easy to use for users unfamiliar with business intelligence tools.” – Matias G., Digital Marketer.
“I like this tool because it is easy to integrate with other platforms. I like that it is very easy to use.” – Pryor R., Senior System Administrator.
Who GoodData Is Best For
- Organizations requiring governed reporting: Particularly suitable when consistent metrics and controlled self-service reporting matter across different teams.
- Multi-tenant SaaS companies: Best when dashboards and reports need to be distributed across multiple customer accounts using shared business definitions.
9. Sisense: Best for Customizable Dashboard Reporting and Embedded Analytics

Sisense is an embedded analytics and business intelligence platform that helps organizations connect data sources, build interactive dashboards, and deliver reporting experiences through both standalone analytical interfaces and third-party applications. It provides data modeling, visualization, reporting, APIs, and developer SDKs for different implementation requirements.
Sisense supports live connections to source systems alongside ElastiCube-based modeling, giving organizations options for preparing and querying data. Its embedding capabilities include iframes, Embed SDK, SisenseJS, and Compose SDK, while multi-tenant deployments can use shared models, dedicated models, or hybrid configurations depending on security and application requirements.
Key Features
- Interactive dashboard reporting: Build dashboards with charts, KPI widgets, filters, drilldowns, and customizable analytical views.
- Live connections and ElastiCube: Query supported databases and warehouses directly or use modeled data for reporting workloads.
- Data modeling and integration: Connect multiple sources, define relationships, and prepare analytical models.
- Scheduled reports and alerts: Distribute reporting content and notify users about important metric changes through supported reporting and alerting functionality.
- Embedded analytics and SDKs: Integrate dashboards and visualizations into applications using iframes, Embed SDK, SisenseJS, or Compose SDK.
- Multi-tenant security and customization: Support row-level security, tenant data segregation, white labeling, and developer-controlled reporting experiences.
Pricing
Sisense currently offers Self-Serve and Enterprise options. Its Enterprise plan is configured around individual customer requirements, and Sisense does not publish a standard Enterprise price on its public plans page. A free trial is available, while Enterprise buyers need to contact Sisense for specific pricing.
Where Sisense Shines
- Combining data modeling and reporting: Teams can connect, prepare, and model data before delivering interactive dashboards.
- Supporting different deployment requirements: Sisense offers SaaS, dedicated cloud, and on-premises options for organizations with specific infrastructure needs.
- Providing flexible customization: Developers can extend dashboard functionality using SDKs, APIs, scripts, and supported customization tools.
- Supporting multi-tenant reporting: Shared, dedicated, and hybrid data architectures allow organizations to configure reporting according to customer requirements.
- Delivering reporting within applications: Embedding capabilities allow dashboards and analytics to be incorporated into existing customer-facing workflows.
Where Sisense Falls Short
- Implementation requires architectural planning: Teams need to select appropriate data models, embedding methods, deployment arrangements, and security configurations.
- Advanced customization can require code: Highly specialized dashboard behaviors and visual components may require scripting or SDK development.
- Complex reporting environments need experienced developers: Advanced modeling, dashboard configuration, and performance optimization can involve additional technical work.
- No public pricing: Organizations need a sales conversation before they can accurately estimate licensing and deployment costs.
Customer Reviews
“Sisense offers developers an intuitive interface. Building models (live and elastic) is easy and straightforward.” – Priscilla R., Senior BI Developer.
“I appreciated the intuitive user interface. There’s nothing I dislike about Sisense.” – Verified User in Hospital & Health Care.
Who Sisense Is Best For
- Organizations requiring customizable dashboard reporting: Particularly suitable when teams need advanced data modeling, interactive reports, and developer customization.
- SaaS companies embedding reports: Best when analytics must support application-specific interfaces, tenant segregation, and different deployment models.
10. Metabase: Best for Simple, Affordable Dashboard Reporting and Self-Service BI

Metabase is an open-source business intelligence and reporting platform that helps technical and non-technical users create dashboards, explore datasets, and share analytical reports. It offers a visual query builder for users who do not write SQL, alongside a SQL editor for analysts who need more control over their queries.
Metabase is particularly attractive to startups and smaller organizations that want to introduce self-service reporting without the implementation requirements of a large enterprise BI platform. Its open-source edition provides core dashboarding capabilities, while paid plans add stronger governance, permissions, embedding, and enterprise support.
Key Features
- No-code query builder: Create analytical questions and reports by selecting data, filters, aggregations, and visualizations without writing SQL.
- SQL editor: Allow technical users to write custom queries for complex reporting requirements.
- Interactive dashboards: Combine charts, tables, KPI metrics, and filters into shareable reporting views.
- Scheduled reporting and subscriptions: Automatically distribute dashboards and analytical results through supported delivery methods.
- Database connectivity: Connect to PostgreSQL, MySQL, Snowflake, BigQuery, MongoDB, and other supported sources.
- Embedded analytics and permissions: Paid plans support white labeling, advanced embedding, SSO, row- and column-level access controls, and other governance capabilities.
Pricing
| Plan | Pricing | Notes |
|---|---|---|
| Open Source | Free | Self-hosted, unlimited users, dashboards, and questions. |
| Starter | From $100/month | Includes five users; additional users cost $6/month each, with discounts for annual billing. |
| Pro | From $575/month | Includes 10 users; additional users cost $12/month each. Adds advanced permissions, SSO, white labeling, and embedding. |
| Enterprise | Custom quote | Starts at $20,000/year; adds enterprise support, deployment options, and tailored commercial arrangements. |
Metabase’s paid plans charge for users in addition to the base subscription. Organizations should note that users accessing Metabase through authenticated embeds can count toward licensed users unless covered by an applicable Enterprise arrangement.
Where Metabase Shines
- Making dashboard reporting approachable: The visual query builder allows non-technical users to create reports without learning SQL.
- Providing an affordable starting point: The free open-source edition makes it accessible to teams with limited BI budgets.
- Combining no-code and SQL workflows: Business users can create straightforward reports while analysts use SQL for more demanding requirements.
- Launching reporting quickly: Its relatively simple installation and setup process helps teams establish basic analytical dashboards without extensive implementation work.
Where Metabase Falls Short
- Visualization customization is more limited: Teams requiring highly specialized visual design or complex dashboard layouts may prefer more visualization-focused products.
- Advanced governance requires paid plans: SSO, row-level permissions, white labeling, and several enterprise capabilities are not included in the free edition.
- Performance depends on connected databases: Complex queries and large datasets can require optimization of the source database.
- Per-user pricing can increase costs: Larger internal teams or authenticated external audiences need to account for additional licensed users.
Customer Reviews
“This service is user-friendly for beginners. Overall, it feels developer-friendly and easy to get started with.” – Saurabh B., Software Engineer.
“It’s very easy to code and generate the required reports. The editor is also very intuitive, and the app is user-friendly overall.” – Verified User in Computer Software.
Who Metabase Is Best For
- Startups and smaller analytics teams: Particularly suitable when affordability, straightforward setup, and accessible reporting are priorities.
- Organizations introducing self-service BI: Best when business users need to explore data independently while technical users retain SQL capabilities.
11. Zoho Analytics: Best for SMBs Needing Affordable Dashboard Reporting and Automated Insights

Zoho Analytics is a self-service business intelligence and reporting platform that helps organizations connect data sources, prepare datasets, create interactive dashboards, and automate report distribution. Its drag-and-drop interface allows users to build charts, pivot tables, KPI widgets, and detailed reports without requiring extensive technical knowledge.
Zoho Analytics is particularly attractive to small and mid-sized businesses already using other Zoho applications. It integrates with Zoho CRM, Zoho Books, and other services, while Ask Zia adds conversational reporting and AI-assisted insights. This combination makes it useful for organizations seeking broad reporting functionality without the cost and complexity of larger enterprise BI platforms.
Key Features
- Drag-and-drop dashboard builder: Create interactive reports using charts, tables, pivot views, KPI widgets, filters, and other visualization components.
- Broad data connectivity: Connect spreadsheets, databases, cloud applications, files, and other supported data sources.
- Automated reporting: Schedule report delivery, configure alerts, and keep dashboards updated through supported data synchronization.
- Ask Zia conversational analytics: Generate reports and analytical answers using natural-language questions.
- Data preparation and blending: Clean, transform, combine, and model data from multiple business applications.
- Predictive and diagnostic analytics: Use eligible AI capabilities for forecasting, automated explanations, and investigation of important business trends.
Pricing
| Plan | Pricing | Notes |
|---|---|---|
| Free | Free | Two users, 10,000 rows, five workspaces, and unlimited reports and dashboards. |
| Basic | From $24/month | Billed annually; starts with two users and 500,000 rows. |
| Standard | From $48/month | Billed annually; starts with five users and 1 million rows. |
| Premium | From $115/month | Billed annually; starts with 15 users and 5 million rows. |
| Enterprise | From $455/month | Billed annually; starts with 50 users and 50 million rows. |
Zoho offers monthly and annual billing, with annual subscriptions receiving a discount. Additional users, viewers, and data capacity can be purchased separately, while dedicated-compute deployments require custom pricing.
Where Zoho Analytics Shines
- Providing affordable dashboard reporting: Its relatively low starting price makes interactive reporting accessible to smaller organizations.
- Integrating with the Zoho ecosystem: Companies using Zoho CRM, Books, and other Zoho applications can consolidate data into reporting dashboards.
- Automating routine reporting: Scheduled reports, data synchronization, and alerts reduce repetitive manual work.
- Making report creation accessible: Drag-and-drop tools and Ask Zia help business users create analytical content without extensive SQL knowledge.
- Offering broad reporting functionality: Dashboards, pivot tables, data preparation, AI insights, and forecasting are available within the wider platform.
Where Zoho Analytics Falls Short
- Advanced AI features require higher plans: Organizations seeking its full generative AI, diagnostic, and advanced analytics capabilities may need Premium or Enterprise.
- Customization may not suit highly specialized requirements: Sophisticated dashboard layouts and unusual reporting interactions may require additional work.
- Data limits vary by subscription: Organizations need to evaluate row capacity, user counts, and add-ons as reporting usage expands.
- Advanced modeling introduces complexity: Complex formulas, data relationships, and multi-source analytical models can require technical experience.
Customer Reviews
“I like Zoho Analytics because it makes data analysis and reporting simple and intuitive. The dashboards are easy to customize.” – Shubhamm D., Data Science Intern.
“There are inbuilt basic reports that organisations can use directly. We can use data from other Zoho apps to turn into reports.” – Verified User in Marketing and Advertising.
Who Zoho Analytics Is Best For
- Small and mid-sized businesses: Particularly suitable when affordability, automated reporting, and simple dashboard creation are major requirements.
- Organizations already using Zoho applications: Best when reporting needs to combine CRM, financial, operational, and other business data from the Zoho ecosystem.
How to Choose a Dashboard Reporting Tool
Start with the reporting experience your users need, then evaluate the data, governance, and operating costs required to deliver it. These five checks will help you narrow the options and make vendor demonstrations more useful.
1. Define Who Will Use the Reports and Where
Internal analysts, operations teams, and SaaS customers need different reporting experiences. Identify who will create dashboards, who will explore them, and who only needs to receive a scheduled report.
For internal reporting, shared workspaces and compatibility with existing business tools may carry the most weight.
For customer-facing analytics, evaluate how reporting fits into your application, follows its permissions, and separates customer data. Have vendors demonstrate the experience from each user’s perspective, including what happens when someone’s role or access changes.
2. Test the Outputs Your Business Actually Delivers
Bring examples of the reports users already depend on. An interactive dashboard, a monthly customer statement, and a scheduled operational report each place different demands on a platform.
Test filtering and drill-downs alongside PDF layouts, pagination, exports, and scheduled delivery. Check whether users can create these outputs themselves and whether formatting survives realistic data volumes.
Qrvey brings embedded dashboards, self-service authoring, and pixel-perfect reporting into the same platform, making it relevant when customers need both interactive exploration and formatted documents.

3. Establish Who Owns Data Preparation and Metric Definitions
A dashboard demonstration can hide considerable preparation work. Ask vendors to connect a representative source and show how they handle joins, transformations, refreshes, and business calculations.
Determine whether your team must prepare analytics-ready data elsewhere or whether the platform provides that processing layer. For warehouse-connected tools, examine how exploration and refreshes affect warehouse usage.
Then trace a familiar metric across dashboards, exports, and AI responses. Consistent results depend on shared definitions and governed data, especially when different teams or customers build their own reports.
4. Put Self-Service and AI Through Real User Tasks
Give a prospective user a practical task: change a metric, create a visualization, answer a follow-up question, and share the result. Observe where they need help from an analyst or developer.
Evaluate AI with the same discipline. Check whether answers use approved business definitions and respect the user’s access permissions.
For multi-tenant products, repeat the exercise with users from different tenants. Include saved reports, exports, and shared content in the test so that customer independence is supported by consistent governance.
5. Compare the Full Cost of Running the Platform
Model costs against your expected mix of report creators, viewers, customers, and workloads. Include licensing, warehouse queries, data processing, implementation, support, and the engineering work needed to maintain integrations.
Ask vendors to price both your initial deployment and a realistic growth scenario. Test concurrent dashboard use alongside refreshes and scheduled reports. Also establish who handles upgrades, failed jobs, and content promotion between environments.
Qrvey’s flat-rate licensing can help SaaS teams plan for broader adoption, while infrastructure and operational costs still belong in the calculation.
Give Customers More Control Over Reporting With Qrvey
Every recurring report request is an opportunity to give customers more independence. Qrvey helps SaaS teams put dashboard creation, data exploration, and formatted reporting directly inside their applications, with tenant-aware permissions and an experience that matches the product.
Start with a reporting workflow that currently consumes your team’s time. Bring the underlying data, customer roles, and required outputs to see how that workflow could work in Qrvey.
Book a Qrvey demo to explore how customers can answer more questions themselves while your team governs the reporting experience.
FAQs
A dashboard reporting tool is designed for repeatable, interactive reporting across larger or continuously changing datasets. Spreadsheets are useful for flexible analysis and manual calculations, while dashboard tools make it easier to standardize metrics, refresh data automatically, apply filters, and distribute the same reporting experience to multiple users.
In many cases, yes. If the same data is being collected, reformatted, and distributed every month, a dashboard reporting platform can automate much of that workflow through reusable reports, scheduled refreshes, and recurring delivery. Some manual review may still be necessary when reports require commentary, approvals, or interpretation.
Look beyond the number of dashboards created. Useful measures can include dashboard adoption, time saved preparing reports, fewer ad-hoc reporting requests, faster access to information, report completion rates, and whether users can answer routine questions without analyst or engineering support.
Yes. Qrvey supports interactive dashboards alongside pixel-perfect reporting, allowing SaaS teams to provide exploratory analytics and highly formatted outputs within the same analytics environment. This is useful when users need both interactive investigation and structured documents such as statements, operational reports, or other recurring outputs.
Yes. Qrvey can support different levels of reporting access based on the user. Some users can work with predefined dashboards, while authorized power users can create and share their own dashboards or reports from approved data. This gives SaaS teams more flexibility in how reporting is exposed without giving every customer the same level of control.
Natan brings over 20 years of experience helping product teams deliver high-performing embedded analytics experiences to their customers. Prior to Qrvey, he led the Client Technical Services and Support organizations at Logi Analytics, where he guided companies through complex analytics integrations. Today, Natan partners closely with Qrvey customers to evolve their analytics roadmaps, identifying enhancements that unlock new value and drive revenue growth.