


⚡Key Takeaways
- A semantic layer provides a common data vocabulary, ensuring everyone uses the same definitions for metrics and attributes.
- Semantic layers eliminate inconsistent metrics and data silos. By defining calculations once, all reports and dashboards pull from the same logic.
- Semantic layers boost self-service analytics and decision-making speed. Business users can drag-and-drop metrics and run queries without needing to understand underlying SQL or data structure.
- Using a semantic layer improves data governance and scalability. Rules for data access (security, definitions, calculations) are managed centrally, which reduces maintenance effort and errors when data sources change.
In this 2026 guide, we’ll explain what a semantic layer is, why it’s crucial for cloud-based analytics and multi-team environments, and how it works in practice. We’ll also explore different types of semantic layers, a step-by-step guide to building one, real use cases, benefits, and challenges to consider. By the end, you’ll see how semantic layers simplify business intelligence and pave the way for consistent, self-service analytics in modern embedded analytics scenarios.
What Is a Semantic Layer?
A semantic layer is an intermediate data layer that sits between your raw data sources and the end-user analytics tools, translating complex data structures into simple business terms. In essence, it’s like a universal translator for data.
For example, a database might have a table cust_ord with a field ord_val_total. The semantic layer will present this to users as a single, clear metric like “Total Order Value.” It’s still the same data underneath, but now everyone sees and uses a consistent, friendly representation of that data.
Importantly, a semantic layer isn’t just a passive dictionary – it actively enforces business logic. If Marketing defines “Active User” one way and Finance another, the semantic layer requires a single agreed definition (or clearly distinct metrics) so that the entire company uses one version of the truth.
This becomes especially important in complex environments like large enterprises or SaaS applications where data comes from many sources and is used by many stakeholders.
How Does a Semantic Layer Work?
Let’s walk through the typical workflow of a semantic layer, from raw data to user query to result. We can break it down into five stages or components, which together turn the semantic layer into the brains of your analytics operation.
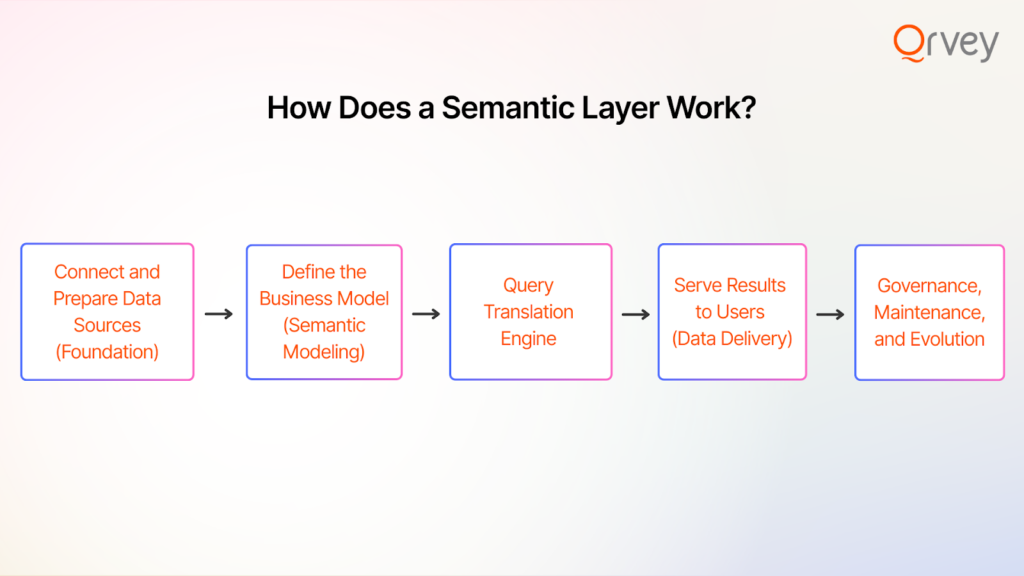
Stage 1: Connect and Prepare Data Sources (Foundation)
First, the semantic layer needs to ingest or connect to the various data sources you have. This could involve connecting to a cloud data warehouse (like Snowflake, Redshift, BigQuery), one or more relational databases, maybe some CSV files or a data lake, etc.
In some cases, data is virtually federated (queried live from the sources); in others, it might be copied into an intermediate store. The goal is to make sure the semantic layer has access to all the relevant data it needs in a structured way.
Key tasks in this stage include:
- Data Integration: If data is scattered, you might perform some integration. For example, linking a customer ID in the sales database to the same customer’s records in a support tickets database. The semantic layer often relies on a unified view or metadata layer of the data. This can involve basic transformations: standardizing date formats, data types, and ensuring reference data (like country codes, product IDs) are consistent
- Defining Relationships: Even at the data prep stage, you’ll identify how tables relate (foreign keys, etc.). For example, you establish that the “CustomerID” field in the Orders table links to the “Customer” table’s primary key. These relationships will later allow the semantic layer to join data correctly when needed. It’s similar to setting up an entity-relationship diagram, but focused on what the semantic layer needs for analysis.
- Data Quality Checks: Some semantic layers also allow you to set basic data quality or filtering rules upfront. For instance, exclude records where status = ‘TEST’ or handle nulls in a certain way. By baking that into the semantic layer, you ensure no analysis accidentally includes junk data.
Stage 2: Define the Business Model (Semantic Modeling)
In this stage, you build the actual semantic model – the centerpiece of the semantic layer. This is where you define how business concepts map to the data. It involves creating entities, hierarchies, and metrics that make sense to end users.
Key tasks in this stage include:
- Create Business Entities (Dimensions): You identify key business entities (also known as dimensions or domains). For example, common ones are Customer, Product, Order, Date, Region, etc. For each entity, you map it to one or more underlying tables or queries. For instance, the “Customer” entity might link to the customers table in the CRM database, and include fields like Name, Industry, Sign-up Date, etc. These entities provide the building blocks that users will slice and dice by.
- Define Metrics (Measures/KPIs): This is crucial – you define all important metrics the business uses. A metric could be simple (like Total Sales = sum of an amount field) or complex (like Customer Lifetime Value which might involve multiple tables and time periods). You formalize these calculations in the semantic layer. Modern semantic layer tools often have a metrics definition language or UI. For example, you might define Conversion Rate as “Orders count / Website Visits count” and it knows which fields in which tables correspond to those. Each metric gets a clear name and formula.
- Set Hierarchies and Relationships: If your data has natural hierarchies (e.g., Geography: Country > State > City; Product Category > Product), you define those. This lets users drill down or aggregate easily. You also establish relationships between the entities for the semantic layer to use. For instance, you tell the model that the Order entity is linked to Customer (by CustomerID), and to Product (by ProductID), etc. This way, if a user wants to see Total Sales by Customer Region, the semantic layer knows it must join the Orders (for sales) with Customers (for region info) on the customer ID.
- Apply Business Rules: Any business-specific logic gets encoded. For example, maybe your company considers an “Active Customer” as one with at least 1 purchase in the last 12 months – you could create an “Active Customer Count” metric with that filter built in. Or perhaps revenue should exclude certain transaction types – the semantic model can incorporate that rule globally. Security rules can also start here – e.g., tag fields that contain sensitive info, mark dimensions that require row-level security by region, etc. (The enforcement can come in Stage 5, but the awareness is built into the model).
All these definitions typically live in a metadata repository of the semantic layer. Some tools use a GUI for modeling, others use YAML or JSON files (which is essentially “metrics as code” – e.g. dbt’s semantic layer definitions are code-based). Regardless of format, the outcome is the same: a formal business layer mapping onto the technical layer.
One important thing to highlight: this stage ideally involves collaboration between data experts and business stakeholders. It’s not done in a vacuum. The definitions should mirror what the business actually uses. Many teams do a few workshops with department heads to nail down things like “Okay, what EXACTLY do we mean by an ‘Active User’? Let’s all agree and then we’ll encode it in the semantic layer.”
Stage 3: Query Translation Engine
Stage 3 is really the execution phase. The semantic layer takes a user’s request (which is phrased in those nice business terms from Stage 2) and translates it into the actual queries on the data.
Here’s what happens when a user asks a question:
- Receive Business Query: Say a user, through an analytics tool, drags “Total Sales” and “Region” into a report and filters to “Last Quarter”. The analytics tool might send that query to the semantic layer (if the tool is directly connected to it), or the semantic layer intercepts it via an API. Essentially, the semantic layer gets something like: Metric = Total Sales, Dimension = Region, Filter = Quarter = Q4 2025 (for example).
- Translate to Source Queries: The semantic layer’s engine knows from the model how to compute Total Sales and what Region means. So, the engine constructs a SQL query (or multiple queries) to fetch this data. The beauty is the end user never wrote that SQL – the semantic layer’s doing it.
- Apply Optimizations: Good semantic layers don’t just naively run queries; they optimize them. For instance, if there’s a pre-aggregated table for Sales by Region by Quarter already, the semantic layer might use that instead of detailed sales data (this could be based on smart caching or materialized views set up as part of the system). Or it might push down filters to the database (so the database does the heavy lifting of filtering Q4 2025 in our example).
- Handle Complex Calculations: If the user’s question involves a more complex metric, like a year-over-year growth or a share-of-total, the query engine may have to do multiple passes. The semantic layer often handles these multi-step operations behind the scenes. These are things that would be error-prone if every analyst did them manually; the semantic layer makes it repeatable and consistent.
Stage 4: Serve Results to Users (Data Delivery)
Stage 4 is about delivering the results back to the user’s tool of choice in a seamless way. The semantic layer essentially acts as a uniform data source or middleware for all front-end applications.
What happens here:
- Format the Output: Depending on what’s querying the semantic layer, the output format might vary. If it’s a BI tool using SQL, the semantic layer might present itself as a virtual database – the BI tool just gets a table of results as if it queried a normal DB. If it’s an API call, it might return JSON.
- Feed Multiple Tools: One huge advantage of a semantic layer is that it can feed many different tools from the same consistent source. A finance user could be in Excel using an ODBC connection to the semantic layer. A web app could be making REST API calls to it to get data for embedded analytics. All of these are hitting the same semantic definitions.
- User-Friendly Presentation: Many semantic layers also expose the friendly names and descriptions to the tools, so users see a nice catalog of fields. If you’ve ever connected an analytics tool to a well-modeled dataset and seen things like a hierarchy icon next to “Date” or a sigma icon next to “Total Sales”, that’s the semantic layer at work making the presentation intuitive.
- Realtime or Cached Delivery: If the same query is asked frequently (e.g., a dashboard that refreshes every hour with “sales by region”), the semantic layer can cache the result so subsequent calls are near-instant. Then it just serves from cache until underlying data changes or a certain time-to-live expires. This caching is a big performance boon for large deployments.
To put it simply, Stage 4 is about making the semantic layer’s answers accessible to the people who need them, in the tools they already use. The end-user experience at this stage is: they ask a question or refresh a dashboard personalized to them, data comes back, and it’s consistent with what others get for the same question.
Stage 5: Governance, Maintenance, and Evolution
This stage is continuous and ensures the semantic layer remains reliable as things change over time.
Important aspects of Stage 5 include:
- Security & Access Control: The semantic layer often becomes the gatekeeper for data access. In Stage 2, you might have tagged or set up roles; in Stage 5, you enforce them. For example, you implement row-level security so that a sales rep only sees sales for their region. The semantic layer will automatically apply that filter to any query coming from that user or role. It’s a huge win for compliance. If regulations like GDPR require that certain user data be restricted, you can enforce that centrally. Auditing is easier too: since queries funnel through the semantic layer, you can log who queried what.
- Performance Tuning: Over time, usage patterns emerge. Maybe you discover that a particular dashboard is very slow because it’s querying a large table via the semantic layer every morning. In Stage 5, you’d optimize that. Perhaps you create a new aggregated table or a materialized view and update the semantic model to use it for that metric (so Stage 3 can do its job faster). Or you adjust the caching settings to store that result since it’s frequently needed.
- Updating the Model: Business needs aren’t static. In a governed process, you’d have a data steward or team evaluate the definition, add it to the model (Stage 2), test it (Stage 3 & 4), and then publish it for use. At times, you might update or deprecate metrics as business evolves.
- Adapting to New Tools or Data Sources: As your tech stack evolves, the semantic layer should adapt. Essentially, the semantic layer becomes a stable middle layer that insulates the business logic from changes underneath (new data source) or above (new consumption tool).
In Stage 5, the semantic layer becomes a mature, managed service in your data ecosystem. It’s not a set-and-forget thing – it requires care and feeding, but in a focused way.

Different Types of Semantic Layers
Not all semantic layers are identical; in fact, the concept can be implemented in various forms depending on your tools and architecture. Here we’ll discuss three common types of semantic layer implementations and how they differ.
Type #1: Semantic Layer Built into an Analytics Tool
Many inadvertently implement a semantic layer inside their BI or embedded analytics tool. This is the classic approach from tools like Tableau, Power BI, Qrvey, Looker, etc., which each have their own modeling layer that sits between data sources and their visualizations.
This approach ensures tight integration with the visualization layer, which can make things very user-friendly for that tool’s users. Performance is often optimized because the tool can make assumptions (e.g., Power BI’s Vertipaq engine pre-computes a lot when you import data).
It can be quicker to set up initially for that specific context, and business analysts are often comfortable building these models without needing a separate system. However, governance can become a headache unless you enforce centralization within the tool.
Type #2: Semantic Layer within the Data Warehouse
In this approach, the semantic layer is essentially built into your data warehouse or database environment. You use mechanisms like database views, stored logic, or specialized modeling features of the warehouse to create a semantic layer.
This method ensures the single source of truth is literally the database. Every tool connecting to the warehouse sees the same curated views/tables. Performance can be excellent, because it leverages the native database engine for joins and aggregations.
However, it can be less flexible when you have multiple data sources (if not all data is in one warehouse). Also, not all business logic is easy to do in SQL views – complex metrics might require maintenance-heavy SQL or periodic ETL.
This works best when you have a homogeneous environment (most data in one place) and a data team to manage those views diligently.
Type #3: Code-Based Semantic Layer in Data Pipelines (Metrics as Code)
Another way to implement a semantic layer is to integrate it into your data transformation pipeline. This is often referred to as the “metrics layer” or “metrics as code” approach. Tools like dbt (data build tool) have popularized this pattern recently. This approach is popular in tech-savvy data teams, especially those embracing analytics engineering.
This approach offers version-controlled, testable metrics definitions. Treating metrics like code means you can do code reviews, use git, and ensure consistency across environments. It also often means the heavy computation is done ahead of time (materialized), so queries are faster at runtime. There’s no separate semantic server to run – it’s part of your data pipeline. If your team is already doing data transformations in dbt/Spark, it’s a natural extension to also define metrics there.
On the flip side, with this approach, you lose some ad-hoc flexibility; the semantic layer here is only updated when the pipeline runs. If a user wants a new metric, it has to be coded and the pipeline re-run – they can’t just define it on the fly in a tool.
Also, if different tools need slightly different variations, you either have to code multiple versions or convince everyone to align to one. This approach is popular in tech-savvy data teams, especially those embracing analytics engineering.
Each of these types isn’t mutually exclusive – you can combine them (and many companies do over time). The key is recognizing the need for a semantic layer and planning it in a way that fits your ecosystem. Next, we’ll look at what happens if you do or don’t have a semantic layer – to cement why all this effort is worth it.
Semantic Layer vs. No Semantic Layer
Is implementing a semantic layer worth it? Let’s compare an organization’s analytics environment with a semantic layer versus one without (i.e., everyone doing their own thing). This will highlight the concrete differences in day-to-day data operations and outcomes:
| Category | With a Semantic Layer | Without a Semantic Layer |
| Metrics Definitions | Product-wide metrics defined once and reused across all embedded experiences | Metrics redefined per feature, team, or customer, causing inconsistencies |
| Ease of Use | Analytics exposed in business terms for product teams and end users | Analytics tied to raw schemas and technical knowledge |
| Time to Insight | Faster feature delivery using pre-modeled metrics and logic | Slower releases due to repeated query and logic development |
| Data Governance | Centralized security and row-level access enforced across tenants | Inconsistent tenant isolation and security gaps |
| Scalability | Supports multi-tenant growth with shared, extensible models | Scaling increases fragmentation, performance issues, and risk |
Figure 1: Comparison of ‘with’ or ‘without’ a semantic layer specifically for the SaaS embedded analytics use case.
Metrics Definitions
With a semantic layer: Unified and centralized.
Metrics (KPIs) are defined once in the semantic layer and reused everywhere. For example, “Gross Margin” or “Active Users” has one official formula. Reports across departments all pull from that same definition, so no conflicting numbers in meetings.
Without a semantic layer: Divergent and scattered.
Each team/tool might define metrics differently. Finance might include refunds in Revenue while Sales doesn’t, yielding different values. There’s no single point of truth, so “definition drift” occurs. A lot of time is wasted reconciling whose number is right.
Ease of Use
With a semantic layer: User-friendly data access.
Business users see familiar terms. They can ask questions without writing SQL, using drag-and-drop fields that make sense (e.g., “Customer Count”, “Revenue Growth %”). This lowers the technical barrier and empowers analysts and even non-analysts to do self-service exploration. The complexity (joins, calculations) is handled behind the scenes.
Without a semantic layer: Technical barriers.
Users often need to know which data source or table to use. Retrieving something simple might require writing a SQL query or asking a data engineer. This limits self-service to only those with technical skills. Others are stuck waiting for data requests to be fulfilled. The data remains in silos of expertise.
Time to insight
With a semantic layer: Faster, consistent reporting.
A new analysis can be spun up quickly by leveraging the existing semantic model. Since the heavy logic is already defined and optimized, users spend more time analyzing and less time prepping data. Also, one change in the semantic layer (say, a new product line added) cascades automatically to all analytics, saving redundant update work.
Without a semantic layer: Slower, duplicated efforts.
Every new report often starts from scratch – writing queries, cleaning data, redefining calculations. Different analysts might repeat the same work in parallel unknowingly. If something changes (like a new business rule), dozens of reports/queries have to be updated individually. It’s like reinventing the wheel for each analysis, which delays insights.
Data Governance
With a semantic layer: Centralized control.
Security rules and data masking are applied in one place (the semantic layer) and consistently enforced across all tools. For example, if regional managers should only see their region’s data, the semantic layer filters it for any query they run. Audit logs from the semantic layer show who queried what. Compliance is strengthened because it’s easier to ensure everyone is viewing data they are permitted to see, and sensitive fields are uniformly protected.
Without a semantic layer: Decentralized (inconsistent) control.
Each tool might have its own implementation of security (if at all). One report might accidentally expose data it shouldn’t because a filter was forgotten. It’s harder to audit access because queries happen in various places (some in BI tools, some in Excel, some directly on databases). Ensuring GDPR or HIPAA compliance, for example, becomes a whack-a-mole game across systems. Gaps and leaks are more likely.
Scalability
With a semantic layer: Scales efficiently.
As the organization grows, you can add new metrics or data sources to the semantic layer, and immediately many tools can leverage them. Onboarding a new department’s data becomes easier – integrate it into the semantic model and suddenly it’s available in all reports.
The semantic layer can handle increasing load by scaling infrastructure or caching heavy queries (some semantic platforms handle hundreds or thousands of concurrent queries by many users). Overall, growth is about extending one model rather than proliferating many disparate data marts.
Without a semantic layer: Hard to scale.
More data and users often exacerbate existing issues. Each new department might set up its own analytics pipeline, leading to a patchwork of definitions. If 50 people using the data was tricky, 500 people is chaos without a central layer – you get 500 slightly different ways to interpret data. Performance issues might appear (duplicate heavy queries hitting the database from different teams).
The lack of a central model means any expansion multiplies inconsistency risk. Often organizations in this state resort to heavy manual governance (committees, spreadsheet-based documentation of definitions) which is hard to enforce in practice.
In short, having a semantic layer brings order, speed, and confidence to data analytics, whereas not having one often results in disorder, delays, and mistrust.

How to Build a Semantic Layer (Step-by-Step)
Implementing a semantic layer may sound daunting, but it can be tackled in a systematic way. Here’s a step-by-step blueprint that you can adapt to your organization. These steps assume you’ve decided a semantic layer is needed and you have some data infrastructure in place (like databases or a warehouse).
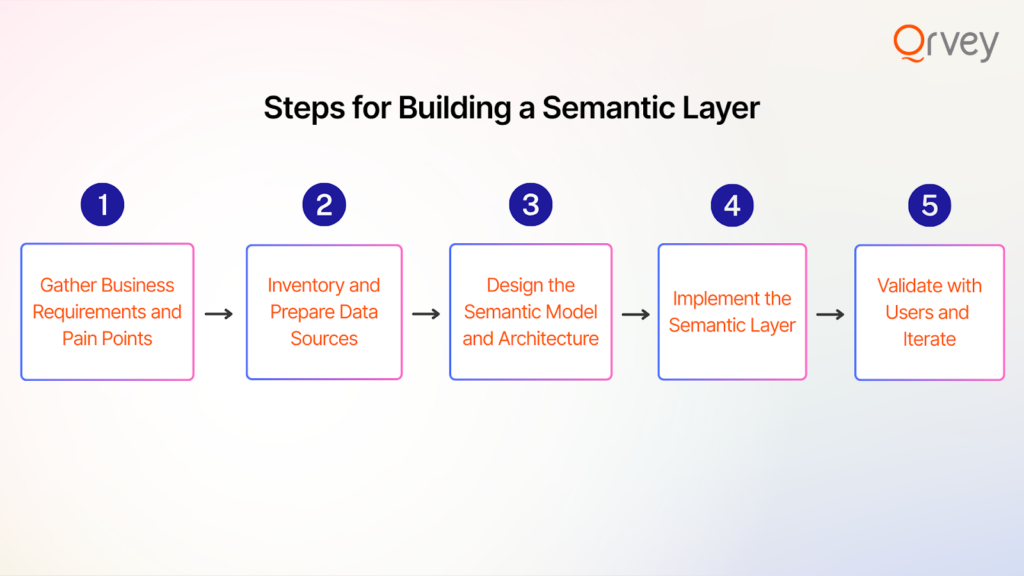
Step 1: Gather Business Requirements and Pain Points
Start by understanding what the business needs from a semantic layer. This means talking to stakeholders and end users of data: executives, analysts from different departments (finance, marketing, operations, etc.), data scientists, and even IT folks who prepare reports. Your goal is to capture: What are the key metrics and dimensions people care about? What inconsistencies or pain points exist today? What tools are people using and how?
At this stage, compile a glossary of business terms and their current definitions (even if they differ by team). Also note any security or compliance requirements people mention. These will shape the semantic layer’s design. It’s useful to document a few concrete scenarios.
Remember to get buy-in at this stage. Explain to stakeholders what a semantic layer is and the benefits (perhaps share an overview like the “with vs without” table above). Gaining executive sponsorship by highlighting how it addresses their pain (trusted data, faster reports, etc.) will help you secure resources and cooperation for the build.
Step 2: Inventory and Prepare Data Sources
Next, take stock of where all the relevant data lives. The semantic layer will sit on top of these, so you need to ensure you can connect to them and trust their content.
Key actions in this step:
- List Data Systems: Identify all databases, data warehouses, files, and even APIs that contain data needed for your metrics and dimensions.
- Assess Data Quality & Consistency: Ensure the sources are in a good state. If Customer IDs in one system don’t match another, you may need a data cleaning step or a mapping table.
- Consolidate if Possible: If you already have an ETL process feeding a warehouse, plan to use the warehouse as the main source to simplify the semantic layer. If data is not yet centralized, decide if you will use the semantic layer’s virtualization or do a quick integration into a temp space.
- Set Up Connections: Ensure you have the technical means to connect the semantic layer to these sources. This might involve coordinating with IT for credentials, opening firewall access, etc.
- Prototype Data Extraction: As a sanity check, try pulling some critical data manually.
Step 3: Design the Semantic Model and Architecture
This involves two sub-steps – designing the logical model (what the metrics and dimensions look like) and choosing the technology/architecture if not already decided.
- Choose the Implementation Approach: From our earlier discussion on types, decide which route (or combination) you’re taking. This choice will influence the specifics of model design. Ensure whichever tool/approach you choose can handle the requirements
- Sketch the Conceptual Model: Based on Step 1’s glossary, sketch a high-level model of how entities relate. Identify any “one-to-many” or “many-to-many” relationships to handle carefully.
- Define Each Metric Precisely: For each important metric, write down its definition in plain English and ideally in pseudo-formula.
- Plan for Slowly Changing or Time-dependent Logic: If some metrics have time components (like “as of date” snapshots) or if dimensions change, decide how the semantic layer will handle it.
- Security & Access Design: Outline which user groups should see what. Make sure your chosen implementation approach supports the needed security filters
- Capacity Planning: Think about the expected data volume and query load. If real-time is needed, ensure your architecture can handle that. If some metrics need ML or complex logic, decide if that’s pre-computed or calculated on the fly.
Step 4: Implement the Semantic Layer
Time to turn the design into reality. This step will vary in specifics depending on your chosen approach/tool, but generally:
- Set Up the Semantic Layer Environment: Install or provision the semantic layer platform if needed. Also configure connectivity to data sources.
- Create the Model (Dimensions & Measures): Start by adding your data sources/tables to the semantic layer and establishing the relationships.
- Implement Hierarchies and Aliases: If your tool supports hierarchies (e.g., date drill downs, product category rollups), set those up now. Also, alias or rename fields to be friendly.
- Security Configuration: Apply those security rules you planned. In many systems, this involves defining roles or filters.
- Optimize (if needed): Depending on the tool, you might set certain performance options.
- Internal Testing (technical validation): Before showing it to end users, the data team should test the semantic layer thoroughly. This means running queries to see if the results match known correct values.
- Iteration & Bug Fixing: It’s normal to find some issues. Perhaps a relationship was set incorrectly causing duplication (common for many-to-many things), or a metric formula needs tweaking (maybe excluding cancelled orders, etc.). Fix these now. It’s much easier to correct at this stage than after broad release when people might start questioning numbers in a meeting.
Don’t be discouraged if this step is a bit time-consuming. Building a robust semantic layer is like building a mini-application – it requires careful configuration and testing, but once it’s done, it will save an enormous amount of time later.
Step 5: Validate with Users and Iterate
This final step is about ensuring that the semantic layer actually delivers value to end users and tweaking it based on their feedback. It’s a combination of user acceptance testing (UAT), training, and iteration. After this step, you should have the semantic layer fully in production use, with users increasingly relying on it for their analytics.
Practical Semantic Layer Use Cases
Semantic layers might sound a bit abstract until we see them in action. Let’s go through a few concrete scenarios where a semantic layer makes a big difference.
Use Case 1: Embedded Analytics in a SaaS Product (Multi-Tenant Data Consistency)
Imagine you run a SaaS company that provides an analytics platform for e-commerce businesses. Each of your customers (tenants) logs into your application to see dashboards and reports about their e-commerce data (sales, site traffic, conversion rates, etc.).
You have dozens (or hundreds) of customers, each with their own slice of data. You want to offer them flexible analytics – maybe even the ability to explore data ad-hoc – but you face a challenge: you need to ensure each customer’s data is isolated and metrics are consistently defined across all customers.
You need to implement a multi-tenant semantic layer as part of your product’s analytics architecture. Instead of managing separate analytics environments per client or risk inconsistency, one semantic layer environment serves all clients with guaranteed separation and uniformity.
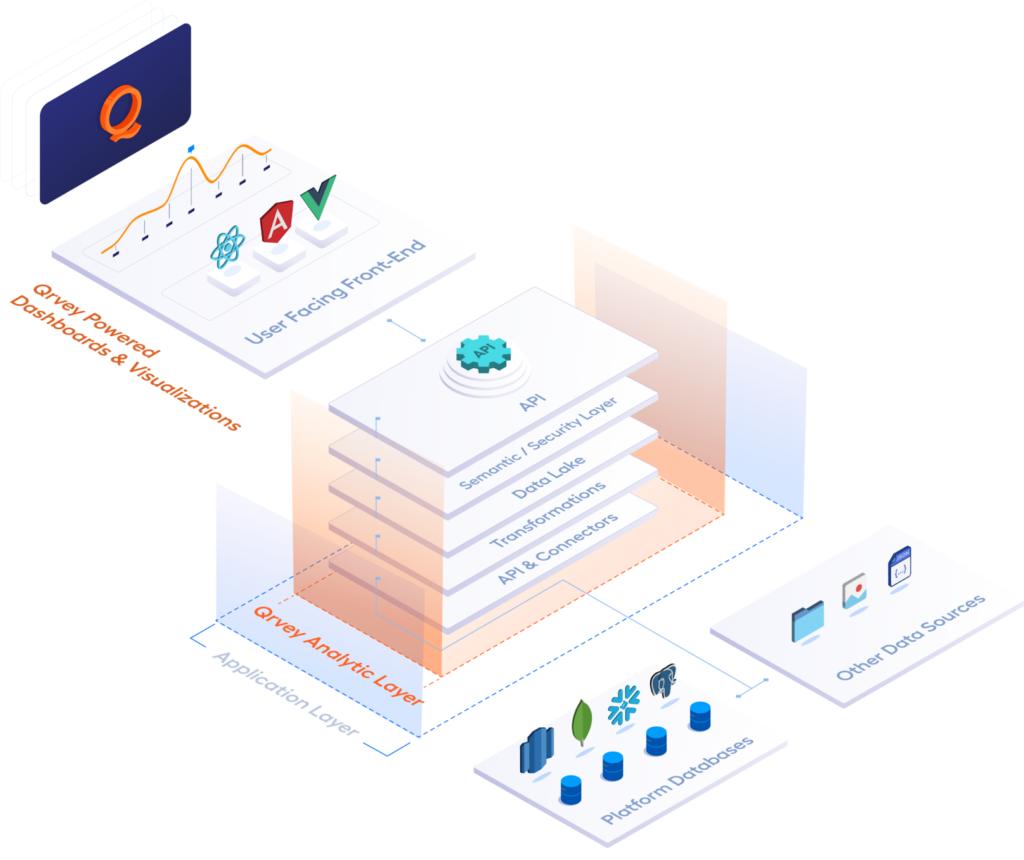
Many embedded analytics solutions leverage this concept – Qrvey, for instance, has a built-in semantic layer that inherits your SaaS app’s multi-tenant security model, so each tenant only sees their data automatically, and you define metrics once globally.
For your developers, this drastically reduces development time – they build the analytics logic one time instead of for each customer. For your customers, it means reliable and rich analytics that feel custom but are actually standardized under the hood. A win-win.
Use Case 2: Enterprise-Wide Analytics Alignment in a Large Company
Fortune 500 company has multiple departments – Sales, Marketing, Finance, Operations – each with their own reporting systems and tools. Over the years, each department created their own reports and even their own data marts.
As a result, when the C-suite asks a simple question like “What’s our customer churn rate?”, Sales might give one answer (based on CRM data), Finance another (perhaps based on subscription cancellations), and Customer Success yet another definition. It’s become a running joke that “we have at least 3 versions of every metric”. This undermines confidence in the data and decisions get slowed by debates over numbers.
The company needs to deploy a company-wide semantic layer to act as the unifying data language. It saves enormous person-hours that were previously wasted on duplicate report building and reconciliation. It also promotes a data-driven culture because people trust the data more. When a new question arises, analysts can build on existing metrics without redoing foundation work.
Use Case 3: Accelerating Data Science & AI with a Trusted Data Layer
A data science team in a bank wants to build a machine learning model to predict customer churn. They need a large dataset combining customer demographics, account transactions, support ticket history, and product usage metrics.
Historically, to gather this data they would need to tap into various databases, write complex SQL to join it all, and spend weeks just validating that the data is consistent. Additionally, whenever they make a new feature (like average monthly transactions), they have to ensure it matches how the business defines that feature elsewhere.
Meanwhile, the bank is also experimenting with AI-driven analytics – e.g., a chatbot that managers can ask questions like “Which region had the highest growth in deposits last quarter?”. Early tests of the chatbot show it sometimes gives wrong answers because it doesn’t know which data source or definition to use, leading to “AI hallucination” of metrics.
The bank decides to implement the semantic layer as a foundation for AI and advanced analytics.
This use case shows how semantic layers are not just for traditional BI – they also play a key role in data science and AI efforts by ensuring those efforts are building on a solid, consistent data foundation. It reduces duplication between analytic teams. How many times has a data scientist computed a metric in Python that a BI analyst had already computed in SQL slightly differently? With a semantic layer, you reduce those silos.
For AI applications, the semantic layer greatly improves reliability. Business users are more likely to trust insights from an AI if they know it’s using the same “numbers” as official reports.
What Are the Benefits of a Semantic Layer?
Implementing a semantic layer can feel like a big effort, so it’s important to articulate the return on investment. We’ve touched on many of these already, but let’s list the key benefits clearly:
1. Single Source of Truth (Consistent Metrics)
A semantic layer enforces consistent definitions for metrics and dimensions across the organization. This means everyone in the company is working with the same numbers when they talk about a metric. The benefit is a huge reduction in conflicting reports and confusion.
2. Empowered Self-Service & Faster Insights
With the semantic layer simplifying the data, business users can self-serve more easily. Analysts and even non-analysts can drag and drop to create reports or answer questions on the fly without waiting for a data expert to prepare the data. The semantic layer abstracts the complexity (joins, calculations, etc.), so a marketing analyst doesn’t need to write SQL.
3. Reduced Errors and Improved Data Quality
When calculations are done manually or separately by dozens of people, errors creep in (typos, formula mistakes, forgetting a filter). A semantic layer dramatically reduces the risk of errors because the logic is defined once and likely tested thoroughly.
4. Centralized Data Governance and Security
Instead of implementing data access controls in every tool (and hoping none are overlooked), the semantic layer provides a central point to enforce security and privacy. You can set who can see what data (row-level, column-level security) once, and all queries honor it. This is a big benefit for compliance with laws (like GDPR, HIPAA) and internal policies. It also produces a clear audit trail of data usage.
5. Efficiency and Scalability
Once the semantic layer is set up, adding a new metric or accommodating new data is far more efficient than the old way. You get a lot of reusability – define a metric once, use it in 100 places. As the organization grows (more data, more users), the semantic layer scales to serve them without linear growth in data team workload. On the technical side, semantic layers can improve performance by caching frequent results or pushing optimized queries.
6. Improved Collaboration and Data Literacy
When everyone is looking at data through the same lens, it fosters collaboration. Teams can share reports and know others can understand them because the terms are standard. It also helps break down jargon barriers – the semantic layer translates “IT speak” to “business speak”.
Challenges and Considerations When Implementing a Semantic Layer
Implementing a semantic layer brings a lot of benefits, but it’s not a magic button you press. It requires thoughtful planning and ongoing maintenance. Let’s talk about some common challenges and pitfalls organizations face, and considerations to navigate them:
Initial Design and Alignment Effort
Getting agreement on metric definitions and business logic can be time-consuming. Different stakeholders might have ingrained ways of calculating things and may resist change). The initial modeling phase might require numerous meetings to harmonize definitions.
This consensus-building takes effort and strong facilitation. Additionally, designing a model that serves all needs without being too complex is tricky – go too simplistic and some teams might feel it doesn’t capture their nuance; too complex and it becomes hard to maintain.
It’s vital to have executive sponsorship to drive alignment. Emphasize the bigger picture benefit of consistency to overcome territorial behavior about metrics. Start with a manageable scope – maybe first unify the top 10 metrics that matter rather than every single field in the company. Demonstrating quick wins on a subset can build momentum and trust to tackle more.
Tool Compatibility and Integration
Not all tools may seamlessly integrate with the semantic layer of choice. Most mainstream ones are supported, but there can be hiccups. There’s also the scenario where existing systems have to be retrofitted – dozens of reports might need to be repointed to the semantic layer.
During tool selection, weigh how well it plays with your current ecosystem. Many modern semantic layers use standard protocols (SQL, MDX, etc.) which is good. You might plan a phased migration – e.g., new reports use the semantic layer, and gradually update legacy reports. Provide guidance/documentation on how users of each tool should connect (e.g., ODBC setup instructions, etc.).
Performance Concerns
If not designed well, the semantic layer could introduce performance bottlenecks. For instance, if every query goes through an extra layer, will it slow things down? Or if many users hit it at once, can it handle the load? There’s also the risk of overloading source systems if the semantic layer generates heavy queries (especially if users drag in a lot of data). Some teams might worry that adding a semantic layer adds latency.
Performance can be managed with good practices: create aggregate tables for frequent calculations, use caching, and ensure the semantic layer is properly scaled. It’s wise to monitor after rollout: track query times and usage patterns, then refine. So have a plan for performance tuning as part of the project.
Turn your semantic layers into actionable analytics with Qrvey
So, you’ve established (or are planning to establish) a robust semantic layer – how do you make the most of it? The ultimate goal is to translate that well-governed data into actionable insights for end users of your customers. This is where pairing your semantic layer with a powerful analytics platform can turbocharge the value. One such platform is Qrvey.
Qrvey is an embedded analytics platform designed specifically for SaaS. It’s multi-tenant architecture is built to integrate with your data environment (including semantic layers) and deliver a full suite of self-service analytics capabilities – from interactive dashboards to automated insights and workflow actions – all in a scalable way. If you’re considering this route, you might be interested in booking a demo to see it in action with your data.

David is the Chief Technology Officer at Qrvey, the leading provider of embedded analytics software for B2B SaaS companies. With extensive experience in software development and a passion for innovation, David plays a pivotal role in helping companies successfully transition from traditional reporting features to highly customizable analytics experiences that delight SaaS end-users.
Drawing from his deep technical expertise and industry insights, David leads Qrvey’s engineering team in developing cutting-edge analytics solutions that empower product teams to seamlessly integrate robust data visualizations and interactive dashboards into their applications. His commitment to staying ahead of the curve ensures that Qrvey’s platform continuously evolves to meet the ever-changing needs of the SaaS industry.
David shares his wealth of knowledge and best practices on topics related to embedded analytics, data visualization, and the technical considerations involved in building data-driven SaaS products.
Popular Posts

Why is Multi-Tenant Analytics So Hard?
BLOG
Creating performant, secure, and scalable multi-tenant analytics requires overcoming steep engineering challenges that stretch the limits of...

How We Define Embedded Analytics
BLOG
Embedded analytics comes in many forms, but at Qrvey we focus exclusively on embedded analytics for SaaS applications. Discover the differences here...

White Labeling Your Analytics for Success
BLOG
When using third party analytics software you want it to blend in seamlessly to your application. Learn more on how and why this is important for user experience.