


⚡Key Takeaways
- Automated data analytics uses software, AI, and machine learning to collect, clean, analyze, and deliver insights without your team doing it manually, sprint after sprint
- For SaaS companies, the highest leverage application is embedding automated analytics into your product, so customers get real-time insights without ever leaving your platform
- Automation saves time and money. SaaS teams that shift from manual, in-house analytics builds to a purpose-built embedded platform report up to 50% lower cloud infrastructure costs
- Choose a platform with native multi-tenant architecture, no-code workflow automation, and deployment inside your own cloud, not a vendor’s shared infrastructure
Every sprint, someone on your team is fixing a dashboard, writing a one-off report, or fielding a data export request that should have been self-serve yesterday. That’s the tax of not automating analytics, and it compounds.
Automated data analytics is how you stop paying for it: AI and machine learning handle the data pipeline, analysis, and delivery so your team doesn’t have to. Here’s what it looks like inside a SaaS product, what to build first, and where it pays off fastest.
What Is Automated Data Analytics?
Automated data analytics is the use of software, AI, and machine learning to move data from raw to insight automatically.
Instead of a data analyst manually pulling queries, cleaning files, and building reports, automated systems handle the entire lifecycle: data ingestion, data preparation, analysis, and delivery.
Your engineering team stops maintaining a hand-built analytics layer (patching dashboards, managing one-off tenant data models, and triaging broken pipelines) and starts building automation that delivers value continuously.

Types of Data Analytics Automation
To build a product that “thinks,” you need to automate several layers of the tech stack. Depending on where your biggest bottleneck is, you might use one type or a combination of several below.
Automated Data Integration and Preparation
Before any analysis can happen, data needs to be clean and consistent. Automated ETL/ELT pipelines pull from CRMs, APIs, databases, and flat files; then clean, normalize, and validate before anything reaches a dashboard.
Gartner estimates poor data quality costs organizations $12.9 million annually. For a SaaS product team, that risk compounds across every tenant. One dirty data source doesn’t just affect one customer but it can corrupt analytics for your entire user base if your ingestion layer doesn’t catch it first.
AutoML and Predictive Modeling
AutoML tools use statistical analysis to find patterns in data automatically with no data scientist required to kick off each analysis run.
This means embedding capabilities like anomaly detection to spot outliers and churn prediction directly into your product, so your customers get proactive insights, not just historical reports.
Automated Reporting and Self-Service Dashboards
This is the “visible” part of the iceberg. Self-service dashboards allow your tenants to query data and build their own views without filing a support ticket or waiting on your product team.
When customers can answer their own data questions, feature request volume drops and product stickiness goes up. That’s a direct line to NPS improvement and lower churn risk.
VIDEO: Where to start with self-service analytics
Automated Monitoring and Alerting
Instead of waiting for someone to notice a problem, automated monitoring watches your KPIs around the clock and triggers alerts when something looks off.
Anomaly detection models can flag a sudden revenue drop, a spike in failed API calls, or a shift in user behavior before it becomes a customer complaint. Pair that with a no-code workflow builder and you’ve moved from reactive to proactive without writing custom code.
Qrvey’s workflow automation features feed into this benefit, embedded directly inside your product.
When to Use Automated Data Analytics
If your engineering team is spending more time maintaining siloed systems than building core features, you’re ready for automation.
Cybersecurity and Real-Time Anomaly Detection
Manual review of security logs doesn’t scale. But machine learning models can identify suspicious patterns (e.g. unusual login behavior, abnormal API traffic, access from unexpected geolocations) and trigger automated responses in real time.
This also means your customers can get security-relevant alerts built into their experience. Think: a property management platform that automatically flags when a tenant account shows unusual access patterns.
Asset and Inventory Management
Predictive maintenance models continuously analyze equipment telemetry and trigger maintenance workflows before a breakdown happens. The same pattern applies to IT asset management: tracking license utilization and expiration dates automatically.
The embedded equivalent is surfacing this kind of operational intelligence directly inside your platform.
A facilities management SaaS, for instance, can give customers automated alerts on equipment health and contract renewals without those customers ever needing to query a database or run a manual report.
Customer Feedback and Service Workflows
Automated surveys triggered after customer interactions, sentiment analysis on support tickets, and real-time Natural Language Processing on product reviews.
For SaaS teams building for customer-facing industries, embedding this feedback loop means your customers’ teams get continuous satisfaction signals without manual effort. Your product becomes the platform they rely on for operational decisions, not just data storage.
Workflow Automation Across Any Business Process
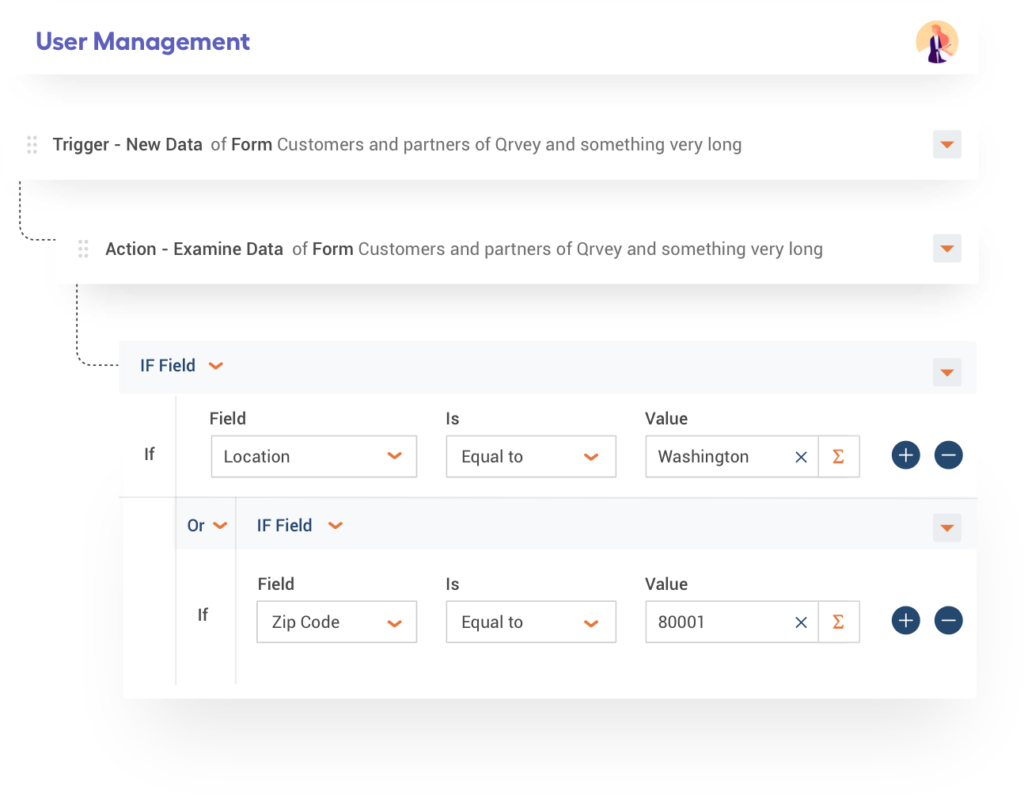
Any repetitive, data-triggered task such as onboarding new customers, provisioning access, and routing support tickets is a candidate for automation. The question is whether your customers can automate their own workflows inside your product.
With an embedded no-code builder like Qrvey’s, your customers can create automations on the fly as their needs evolve.
See a quick example of building an automated workflow in Qrvey in this clickable demo.
Why Businesses Are Moving Toward Automated Analytics
At a certain scale, manual analytics doesn’t just stop at being slow but increases in cost too being expensive. Here are more reasons SaaS teams are shifting to automated analytics.
Faster Decisions
Manual interpretation creates latency. When 76% of enterprises state that real-time data analytics is “essential”, a SaaS product that still delivers weekly batch reports is handing customers a reason to evaluate your competitors.
Lower Operational Cost
Data preparation accounts for roughly 80% of a data team’s time. Automating this work redirects their time toward analysis and decision support.
For SaaS companies specifically, this matters even more: your engineering team shouldn’t be hand-coding ETL pipelines for every new tenant data model. That’s a scaling problem waiting to happen.
Self-Service That Reduces Backlog
When your tenants can answer their own data questions, without filing a request or waiting on your engineering team, your backlog shrinks and your product stickiness grows.
See a quick example of how your users can customize their dashboard with Qrvey.
A fully white-labeled experience means they never leave your product to get those answers.
As Herman Haynes, CIO at Global K9 Protection Group, puts it, adding Qrvey felt “like turning on a light switch.”

Revenue You’re Currently Missing
SaaS companies that package advanced autonomous analytics as a premium tier (automated alerts, scheduled reporting, custom dashboards) turn a cost center into a profit center.
If analytics quality affects renewal decisions (and it does), every month your reporting falls short is another month your renewal conversations get harder.

Key Components of Automated Data Analytics
| Component | Function | Business impact |
|---|---|---|
| Data ingestion | Pulls from API, databases, flat files continuously | Eliminates per-tenant custom ETL work |
| Machine learning | Predictive maintenance and anomaly detection | Gives tenants proactive insights, not just historical reports |
| Automated reporting | Self-service dashboards and analytics for end-users | Reduces feature request volume and improves NPS |
| Continuous monitoring | Real-time analytics and alerting | Surfaces problems before customers file support tickets |
Data Ingestion and Preparation
Data ingestion AKA pulling structured and semi-structured data from CRM systems, APIs, data warehouses, and flat files, needs to happen continuously, not in weekly batch jobs.
The data preparation layer in a multi-tenant SaaS context needs to handle tenant-specific data models without custom code for each customer. That’s where a purpose-built data pipeline architecture pays off over bolting a data warehouse query onto a generic BI tool.
- Automates ingestion from structured and semi-structured sources (JSON, APIs, flat files)
- Applies data governance rules consistently across all tenants
- Flags data quality issues before they reach the dashboard layer
Machine Learning and Predictive Modeling
The key word is automated; these models need to run continuously on fresh data.
Predictive models require:
- Clean, consistently formatted training data
- Automated retraining pipelines when model drift occurs
- Clear explainability so business leaders can act on outputs
Generative AI and Natural Language Processing are increasingly part of this layer too. Users can now ask plain-language questions of their data like “Show me which customers are most likely to churn this quarter”, and get structured answers without writing SQL.
VIDEO: Deliver Effortless Insights with GenAI embedded in your product
Automated Reporting
Automated reporting is a core part of embedded analytics: scheduled exports, triggered alerts, refreshing dashboards, all running without your customers having to leave your product.
Qrvey’s automated reporting runs inside your cloud environment. Your tenants’ data never leaves your infrastructure. That’s a meaningful difference from most embedded analytics options, where data travels through a vendor’s shared SaaS environment.
Continuous Monitoring and Alerting
The last mile of automated analytics is an action.
Continuous monitoring watches data as it changes, compares it against defined thresholds or learned baselines, and triggers responses: a Slack message, a webhook to your CRM, an email to a customer, or an automated workflow that actually does something about the anomaly.
Using Automated Analytics Platforms: What to Look For
The wrong platform means your engineering team inherits a brittle integration instead of a scalable product feature. Look for:
- Multi-tenant architecture: Does it natively isolate data?
- Deployment flexibility: Can it run in your AWS account or Google Cloud?
- Flat-rate pricing: Avoid “success taxes” where costs rise per user.
- No-code builders: Can your PMs create workflows without SQL skills?
- Full JavaScript embeddability: Every component should embed via JS, so the experience looks like your product, not a third-party add-on
Embedding Automated Analytics for SaaS
Here’s how SaaS engineering teams typically structure their implementation.
1. Data Infrastructure
A purpose-built multi-tenant data lake (as opposed to a multi-purpose data warehouse that is serving many different applications and use-cases) means better performance at scale and cleaner data isolation per tenant.
- Choose infrastructure that supports both co-mingled and segregated data models depending on customer requirements
- Container-based architecture (Kubernetes) handles scale without manual intervention during traffic spikes
- Self-hosting inside your own cloud environment (such as AWS, Azure, GCP) keeps data governance in your control
2. Integration with Existing Systems
Data pipelines need to connect to where your data already lives: CRM systems, operational databases, third-party APIs, and event streams. Look for pre-built connectors and webhook support so your team isn’t hand-coding every integration.
- Webhook and API write-back support enables bi-directional automation — not just read-only dashboards
- Avoid siloed systems by building integrations at the data layer, not the dashboard layer
3. Data Governance and Quality
Look for a solution that allows you to define validation rules during ingestion or at query time, instead of being limited to either point. In a multi-tenant deployment, governance across thousands of customers requires automation as manual audits don’t hold up.
4. Upskilling and Training
Automation shifts what your team does, not whether you need one. Plan for that transition deliberately, or the tools won’t get used.
- Build internal playbooks for common automation failures and escalation paths
- Treat data engineering as a core product discipline, not just infrastructure support
5. Cultural Shift Toward Data-Driven Decisions
One report flagged that 80% of organizations will fail at big data initiatives if they proceed without well-defined strategic objectives. For SaaS teams, that failure mode is familiar: analytics features get built, but adoption is low because neither the internal team nor the end users know how to use them.
Getting stakeholders to use the tech (and trust it) takes deliberate change management.
- Start with high-visibility use cases where automated insights are easy to verify
- Give non-technical users self-service dashboards so they can explore data without filing requests
- Tie automation outcomes to business metrics that executives care about
Automated Analytics Examples
Instead of theorizing about roadmap relief, let’s look at how B2B SaaS teams use automated data analytics to turn stagnant dashboards into proactive features that drive daily user engagement.
Automotive Dealership Scheduling
EvenFlow’s data lived in spreadsheets. Service managers had no visibility into parts availability for upcoming appointments, which meant delays and frustrated customers.
By embedding Qrvey’s workflow automation in their AWS stack, EvenFlow automated parts analysis ahead of every appointment.
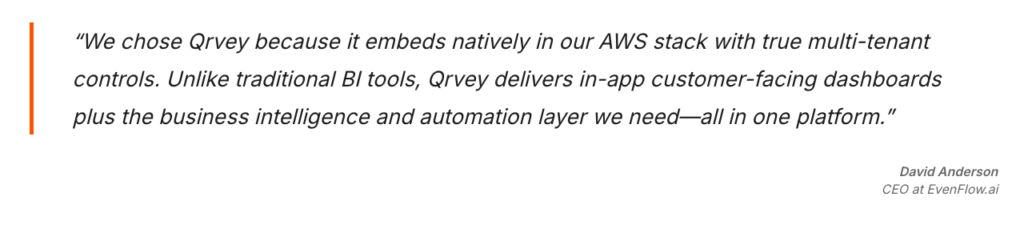
The result: up to 30% reduction in operational capacity inefficiencies and service department customers who show up to a dealership that’s prepared for them.
Predictive Maintenance in Manufacturing
Machine learning models analyzing equipment telemetry can detect early failure signatures e.g. vibration patterns, temperature deviations, and automatically schedule maintenance before the equipment goes down.
Unplanned downtime in manufacturing costs companies an average of 27 hours a month. At over $100,000 per hour, that’s a $2.7 million monthly drain hiding in plain sight. Predictive maintenance that catches failures 48 hours earlier pays for itself fast.
Fraud Detection in Finance
Machine learning models trained on transaction history can flag anomalies in real time: unusual transaction amounts, geographic mismatches, velocity patterns that don’t fit a customer’s profile.
Fraud detection automation catches more fraud and faster, before the financial loss compounds.
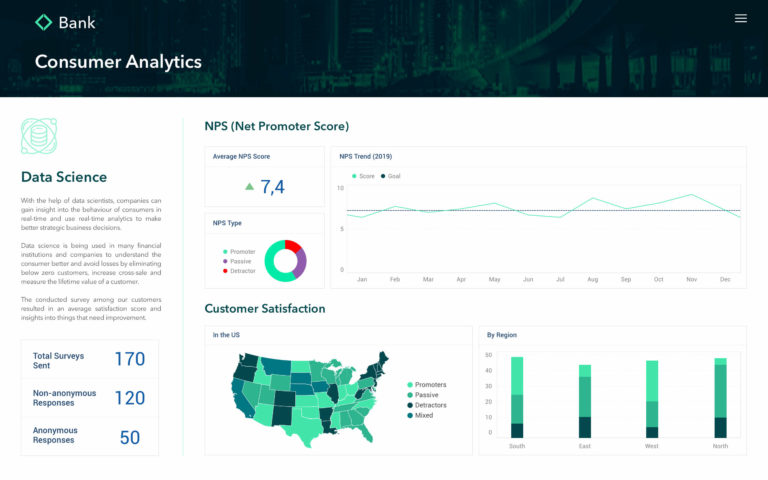
The key technical requirement: real-time pipelines that process events in milliseconds, not batch jobs that run overnight. By the time a nightly batch job flags a fraudulent transaction, the damage is done.
Patient Satisfaction for Healthcare Operations
Hospitals and healthcare operators collect enormous amounts of feedback that largely goes unanalyzed because manually processing it doesn’t scale.
Automated Natural Language Processing can analyze patient feedback in real time, surface dissatisfaction signals, and trigger follow-up workflows before a negative experience becomes a lost patient or a liability.
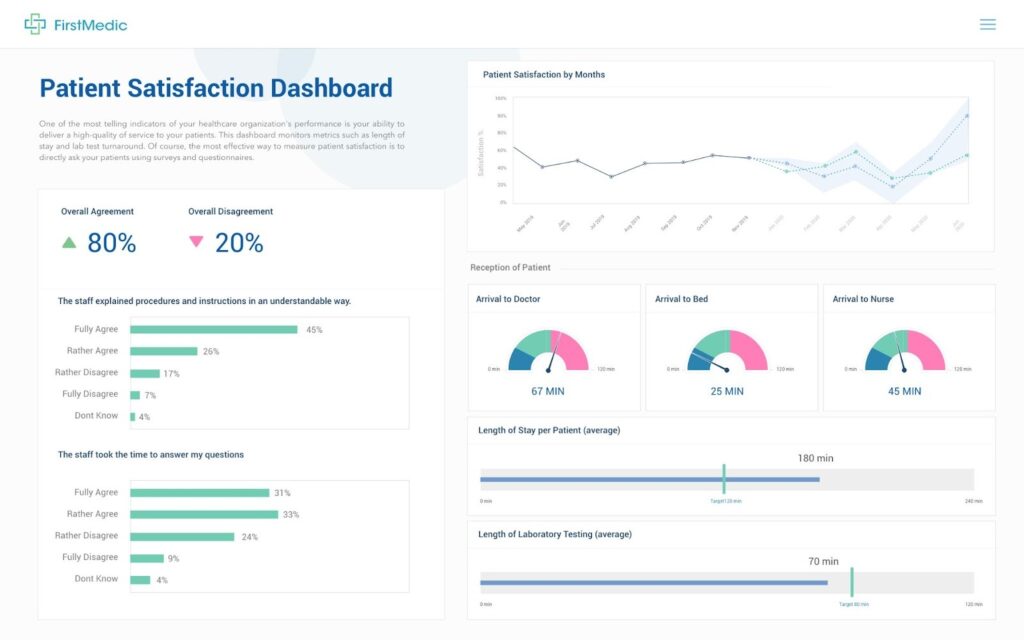
SaaS companies building for healthcare can embed this kind of sentiment analysis directly into their platform, giving care administrators automated alerts on patient care quality trends without requiring them to query a database.
Best Practices and Considerations
While implementing automated analytics, we emphasize the importance of following best practices and addressing key considerations:
1. Data privacy and security
Robust measures must be in place to protect sensitive data and ensure compliance with relevant regulations. At Qrvey, we prioritize data privacy and security, working closely with our clients to implement industry-leading security protocols.
2. Interpretability and transparency
We believe that automated analytics models should be transparent. This allows stakeholders to understand the reasoning behind the insights and decisions.
3. Continuous model monitoring and maintenance
As data patterns evolve, it is essential to monitor and retrain models to maintain their accuracy and relevance. We provide ongoing monitoring and model maintenance services to ensure our clients’ solutions remain up-to-date and effective.
4. Balancing automation with human oversight
While automation can significantly enhance efficiency, we believe in the importance of human oversight and domain expertise.
The Future of Automated Analytics Is Agentic
Gartner VP Analyst Carlie Idoine framed what’s coming:
“By 2027, 50% of business decisions will be augmented or automated by AI agents for decision intelligence…but they must be used collectively with effective governance.”
The shift toward AI agents means:
AI-Driven Automation
AI-powered automation without governance is just faster mistakes. The platforms that win will be the ones that give users a prompt-based, generative AI interface for building automations, while keeping human oversight baked into the workflow.
For SaaS companies, this opens a new product frontier: letting customers describe what they want to monitor or automate in plain language, and having the system build the workflow for them. Agentic analytics is already becoming a differentiator in competitive SaaS markets.
Qrvey’s AI Chart Builder lets your users create charts with natural language, removing manual dashboard requests and helping non-technical tenants query data and get insights easily.
See how to build a chart using AI in Qrvey in this clickable demo.
Explainable AI (XAI)
A predictive model that says “This customer will churn” is useful. One that says “This customer will churn because their usage of Feature X dropped 40% in the last 30 days” is actionable.
Explainable AI makes the difference and it’s becoming a baseline expectation. This is also a data governance requirement in regulated industries. If an automated system makes a credit decision, a healthcare recommendation, or a security action, the reasoning needs to be auditable.
Edge Analytics and IoT
As IoT device density grows, sending all sensor data to a central data warehouse for analysis becomes impractical, both in cost and latency.
Edge analytics processes data at the source, triggering automated responses locally. The central system gets summaries and exceptions, not raw firehoses.
For SaaS platforms serving manufacturing, logistics, or field services customers, embedding edge-aware analytics (where real-time analytics happens close to the device) is becoming a meaningful competitive differentiator.
Automate Your Data Analytics with Qrvey
Unlike most embedded analytics platforms, which started as internal analytics tools and tried to retrofit multi-tenancy afterward, Qrvey was built from day one for multi-tenant SaaS.
That architectural difference matters: true data isolation per tenant, no custom security models to maintain, no shared vendor infrastructure that your customers’ data passes through.
SaaS teams using Qrvey typically ship analytics features 10x faster than building in-house, at 50% lower cloud infrastructure cost, with analytics in front of their customers in weeks and not the 12-18 months a custom build typically takes.
Book a Demo to see how our embedded analytics works inside a real SaaS product
FAQs
- What security measures should an automated analytics system have to protect sensitive customer data?
Look for row-level and column-level security, encrypted session tokens, and tenant isolation controls. Platforms like Qrvey bind security rules to each user session via JWT tokens at runtime.
- Can non-technical users interact with automated analytics dashboards without writing code or SQL?
Yes. Modern platforms offer AI-powered chart builders and natural language queries, allowing business users to explore data and build visualizations without any coding or SQL knowledge.
- How long does embedding automated analytics take?
With a purpose-built platform like Qrvey, most teams go from implementation to customer-facing analytics in weeks — versus the 12–18 months a typical in-house build requires. The ROI Calculator shows what that timeline difference means in dollars.
- Can automated analytics tools like Qrvey work with both live and historical data simultaneously?
Yes. Platforms like Qrvey support blending live transactional data with historical warehouse data on the same dashboard, giving users both real-time and trend-based insights at once.

David is the Chief Technology Officer at Qrvey, the leading provider of embedded analytics software for B2B SaaS companies. With extensive experience in software development and a passion for innovation, David plays a pivotal role in helping companies successfully transition from traditional reporting features to highly customizable analytics experiences that delight SaaS end-users.
Drawing from his deep technical expertise and industry insights, David leads Qrvey’s engineering team in developing cutting-edge analytics solutions that empower product teams to seamlessly integrate robust data visualizations and interactive dashboards into their applications. His commitment to staying ahead of the curve ensures that Qrvey’s platform continuously evolves to meet the ever-changing needs of the SaaS industry.
David shares his wealth of knowledge and best practices on topics related to embedded analytics, data visualization, and the technical considerations involved in building data-driven SaaS products.
Popular Posts

Why is Multi-Tenant Analytics So Hard?
BLOG
Creating performant, secure, and scalable multi-tenant analytics requires overcoming steep engineering challenges that stretch the limits of...

How We Define Embedded Analytics
BLOG
Embedded analytics comes in many forms, but at Qrvey we focus exclusively on embedded analytics for SaaS applications. Discover the differences here...

White Labeling Your Analytics for Success
BLOG
When using third party analytics software you want it to blend in seamlessly to your application. Learn more on how and why this is important for user experience.