


⚡Key Takeaways
- Qrvey stands out as the best self-service analytics solution for SaaS companies, offering multi-tenant architecture that reduces development time by 10x and infrastructure costs by 50%
- Tableau delivers the most impressive data visualizations and is ideal for enterprises needing robust visual analytics capabilities for internal users
- Power BI offers the best value for Microsoft-centric enterprises, with seamless Microsoft 365 integration and an accessible price point at $14/month per user
The benefits of self-service analytics tools sounds great on paper: business users get insights on their own, development teams and analysts get their time back, and everyone’s happy. But in reality? It’s a lot messier, especially for SaaS companies who want to offer self-service analytics. It’s hard to build and scale, navigating multi-tenant architecture is tricky, development teams get overwhelmed with support requests, and leadership starts questioning the ROI.
When users barely touch the dashboards and every “quick” question still funnels back to the data team, is it really self-service?
As operational analytics platform builders ourselves, we’ve watched countless companies struggle with low adoption rates and disappointed users. So, we’ve analyzed the market to find 11 of the best analytics tools for 2026 that deliver on the self-service promise, with clear guidance on which solution fits your specific needs.
| Tool | Best For | Standout Feature | Starting Price |
| Qrvey | SaaS companies needing self-service embedded analytics | Multi-tenant data lake architecture | Flat-rate pricing |
| Tableau | Enterprise-grade visual analytics | AI-powered explanations | $35/user/month |
| Power BI | Microsoft-integrated environments | Microsoft 365 ecosystem integration | $14/user/month |
| Looker | Google Cloud users needing governance | LookML semantic layer | Custom pricing |
| Sisense | Complex data modeling with AI | ElastiCube technology | Custom pricing |
| Domo | Mobile-first analytics experience | Cross-device consistency | Custom pricing |
| Spotfire | Technical teams in data-heavy industries | Advanced data science integration | Custom pricing |
| Zoho Analytics | Small to mid-sized businesses | Low total cost of ownership | $24/month |
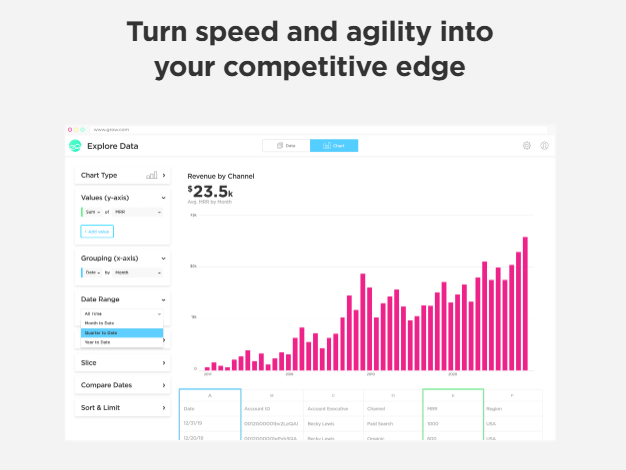
| Grow | Non-technical teams needing no-code solutions | Unlimited users model | Custom pricing |
| Qlik | Large enterprises needing associative data modeling | Associative engine | $200/month |
| IBM Cognos | Organizations needing enterprise governance | Strong security controls | $10/month |
1. Qrvey: Best for SaaS Companies Needing Self-Service Embedded Analytics
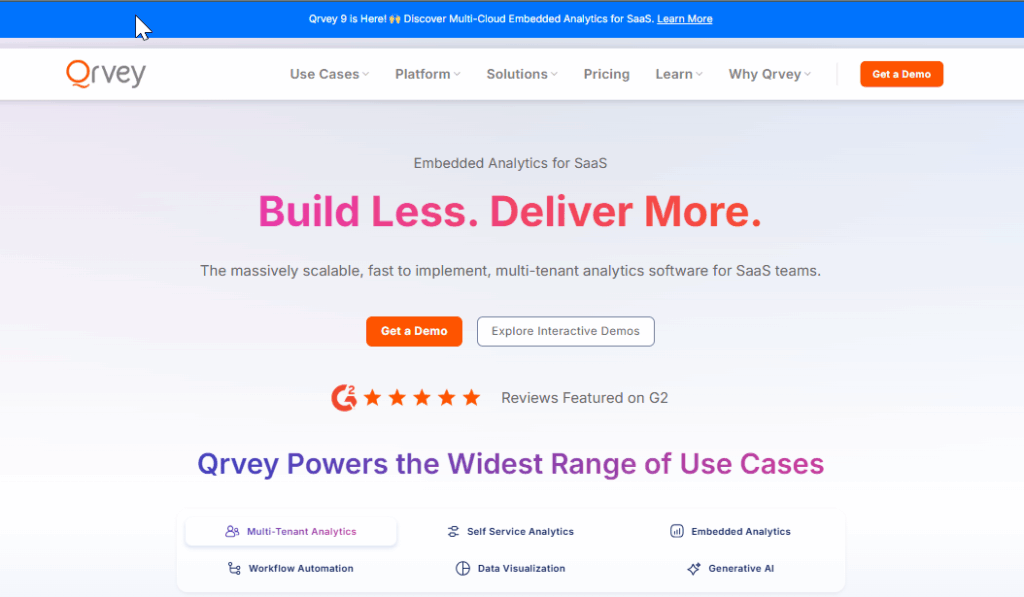
If you’re running a SaaS application, adding autonomous analytics isn’t just a nice-to-have anymore; it’s what your customers expect. But should you build it yourself or buy a solution? The math is simple: building in-house typically takes 6-12 months of development time, while Qrvey can get you up and running in weeks.
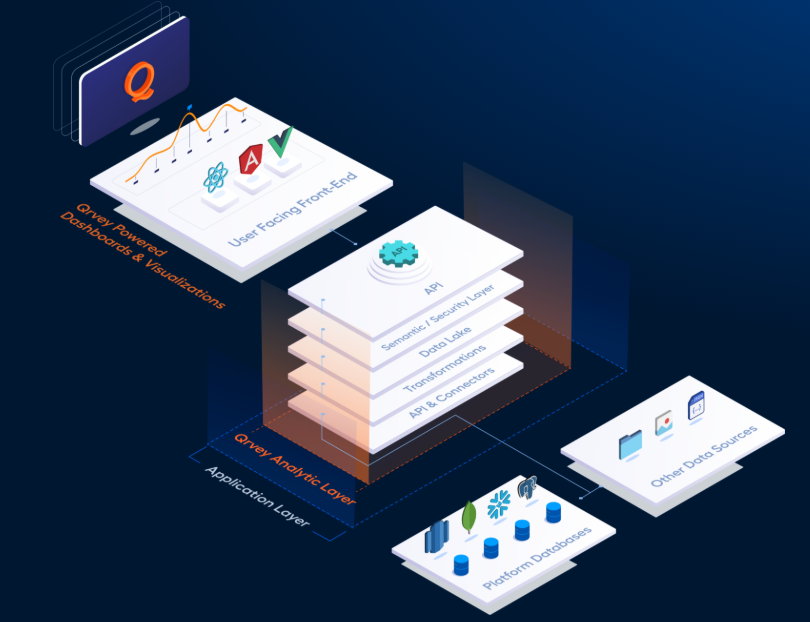
Unlike traditional BI tools that were adapted for embedding as an afterthought, Qrvey was built from the ground up for multi-tenant environments. This means each of your customers gets their own secure analytics space without you having to reinvent the security wheel.
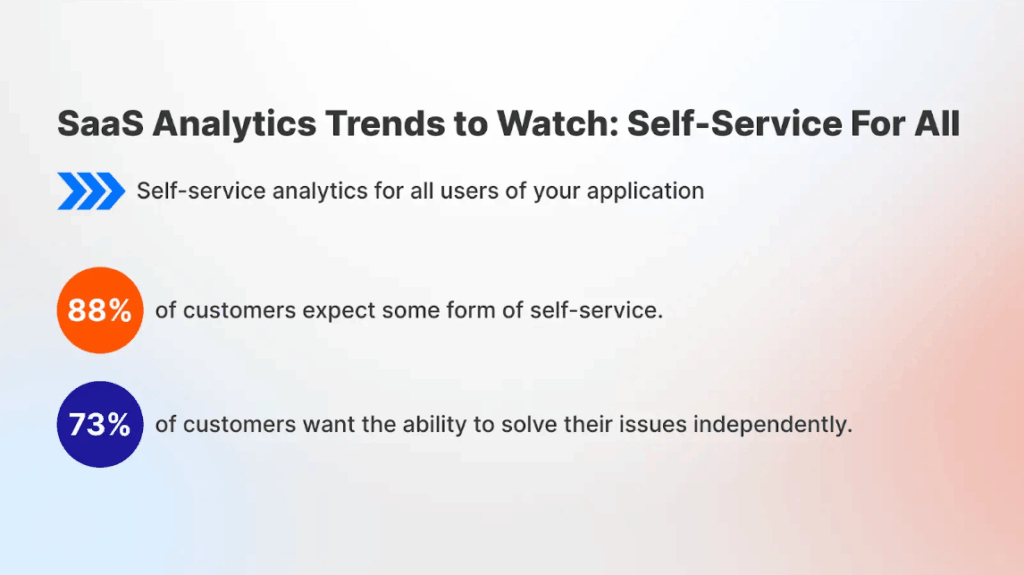
As our CTO, David Abramson puts it: “Most customers want the ability to independently solve their own problems, so the more you can do to provide a rich set of self-service capabilities around the analyses and the data they’re going to work with, goes a long way in satisfying the demands of most end users.”
What makes Qrvey special is it’s a complete embedded analytics stack that handles everything from data management to visualization in a unified platform. In fact, it reflects the principles of an agentic analytics platform, where automation and intelligence drive faster decisions. With this approach, your development team doesn’t need to stitch together multiple tools and can focus on your core product features instead.
Key features
Qrvey delivers a comprehensive embedded analytics experience with several standout capabilities:
Multi-Tenant Data Lake Architecture
Our built-in data lake is powered by Elasticsearch, providing much better scalability than traditional warehouses for multi-tenant environments.
This architecture ensures each of your customers has their data properly isolated while maintaining high performance, even when processing billions of rows of data.
We also play nice with data warehouses. You can offset your data warehouse costs by leveraging Qrvey’s data lake for all your near real-time data queries and use your data warehouse for the real-time data needs. Our customers that use Snowflake have reported a 50% monthly cost reduction with this setup.
See how much you could save with our free Snowflake pricing calculator and read our deep dive on how to Optimize Snowflake Cost.
100% JavaScript Embedding
Iframes are a huge problem for embedded analytics. They create a disjointed experience that screams “this isn’t actually part of our product.” Iframes also slow down performance and provide vulnerabilities you can’t risk.
Qrvey takes a completely different approach with pure JavaScript widgets that integrate directly into your application. This gives you ultimate control over the user experience, allowing agentic framework to feel truly native rather than bolted on. Your users will never know they’re interacting with a third-party solution and that’s exactly the point.
Self-Service Reporting & Dashboard Builder
Qrvey’s intuitive drag-and-drop interface empowers your customers to create their own reports and dashboards without technical expertise.
The builder supports mixing data sources in a single dashboard, applying formulas, creating trends, and implementing conditional formatting. All of this sits on top of that robust multi-tenant architecture, so users only see the data they’re authorized to access. This combination of usability and security is surprisingly rare in the analytics world.
Learn how JobNimbus rolled out customizable self-service dashboard across thousands of tenants with a 70% adoption rate, powered by Qrvey.
Read the case study.
Pricing
If you have thousands of users across your customer base, per-seat pricing quickly becomes unsustainable. Especially if you plan to grow. (What SaaS company doesn’t want to grow?) Qrvey’s approach aligns costs with the value you receive.
| Plan | Description | Price |
| All plans | Full stack multi-tenant platform, unlimited users, dashboards and environments, dedicated support | Flat-rate pricing |
Where Qrvey shines
- Multi-tenant security: Built-in tenant isolation with inheritance models means you don’t have to rebuild complex security policies from scratch. The platform handles role-based access controls and dynamic data filtering automatically, saving your team countless hours of development time.
- Developer experience: The platform is designed specifically for modern SaaS development teams working with SaaS analytics, with comprehensive APIs, documentation, and deployment options. Watch out: Most embedded analytics providers fall short when it comes to deployment capabilities.
More On Why Qrvey
- Self-Service Analytics: Empower your customers to build their own reports, dashboards, and automation workflows, freeing your dev resources to focus n your core product
- Fully Embedded & White-Labeled: Every analytics component e.g builders, filters, and dashboards can be seamlessly embedded and customized to match your product’s look and feel.
- Built-In Data Engine: Handle complex structured and semi-structured data (like JSON and APIs) without relying on an external warehouse or third-party ETL tools.
- Native Multi-Tenant Design: Architected for secure tenant isolation, enabling scalability and personalization for every customer.
- Embedded AI: Enable your end users to have a conversation with the data in natural language with Smart Analyzer for quick access to the insights, and leverage the AI Chart Builder to create charts and dashboards
Spotlight on Qrvey’s Self-Service Analytics Features (Deep Dive)
With Qrvey, you can empower your customers with different degrees of freedom for self-service analytics. Let’s go a bit deeper to understand what is customizable in Qrvey. These are four critical requirements for a true self-service analytics offering.
- Dashboard Building & Customization
- Modify existing dashboards (limited layout changes)
- Create Dashboard from scratch with full layout control
- Visualization Customization
- Choose from preset chart types and colors
- Full control over chart types, colors, labels, themes
- Workflow Customization
- Use predefined workflows and automations
- Design custom workflows automate tasks; integrate APIs
- Dataset Customization
- View preloaded datasets
- Modify datasets;create calculated fields and apply transformation
Where Qrvey falls short
- Consumer applications: Qrvey is optimized for B2B SaaS applications rather than consumer-facing products that tend to have simpler analytics needs.
- Small teams: The enterprise-grade architecture might be more than what very small teams need when just getting started with basic embedded reporting.
Customer reviews
“Excellent platform for embedded, cloud-native analytics and automation”, verified G2 user
Who Qrvey is best for
- SaaS product teams: Looking to embed analytics without building from scratch or compromising on white-labeling capabilities.
- Multi-tenant applications: Serving hundreds or thousands of tenants who each need their own secure analytics environment.
- Engineering teams: Wanting to reduce development time while still maintaining control over the user experience.
2. Tableau: Best for Enterprise Visual Analytics
Tableau has long been the gold standard for data visualization and continues to innovate with AI-powered features. The platform excels at turning complex data into striking visuals that help anyone understand trends and patterns at a glance.
Key features
- Robust visualization library: Offers the widest range of visualization types from basic bar charts to complex geospatial mapping.
- Strong community: Access thousands of pre-built dashboards, visualization extensions, and learning resources.
Tableau’s Pricing
| Plan | Features | Price |
| Viewer | Consumption only | $35/user/month |
| Explorer | Self-service analytics | $70/user/month |
| Creator | Full creation capabilities | $115/user/month |
Where Tableau shines
- Enterprise scalability: Robust governance features make it suitable for large-scale deployments.
- Data connectivity: Connect to virtually any data source, from spreadsheets to complex databases.
Where Tableau falls short
- Integration complexity: Not designed for embedding or for multi-tenant environments, requiring more development work.
- Cost: One of the most expensive options when deployed across large teams.
Customer reviews
“Good looking dashboards – if you got the time, patience & skill” – Rachel H., verified G2 user
Who Tableau is best for
- Data visualization teams: Needing to create striking, interactive data stories.
- Large enterprises: With dedicated analytics resources and significant budgets. Those comparing Qrvey vs Tableau will notice Tableau’s strengths in large-scale deployments, though it may come with trade-offs in cost and integration flexibility.
You’ll find a more detailed breakdown in our guides: Tableau for Embedded Analytics, Tableau Pricing and Tableau Alternatives.
3. Power BI: Best for Microsoft Environments
For organizations already invested in the Microsoft ecosystem, Power BI provides the most seamless integration with Excel, Azure, and other Microsoft services. Its tight coupling with these tools makes it a natural choice for Microsoft-centric teams.
Key features
- Microsoft 365 integration: Direct connections to Excel, SharePoint, and other Microsoft services.
- Natural language queries: Ask questions about your data in plain English.
Power BI’s Pricing
| Plan | Features | Price |
| Pro | Core features | $14/user/month |
| Premium | Advanced features | $24/user/month |
Where Power BI shines
- Microsoft integration: Seamless experience for organizations using Microsoft products.
- Ease of adoption: Familiar interface for Excel users makes training easier.
Where Power BI falls short
- Non-Microsoft environments: Can only be deployed to Azure. Less attractive for organizations using Google Cloud or AWS.
- Advanced customization: More limited than Tableau for highly specialized visualizations.
- No self-service capabilities: PowerBI embedded dashboards are view-only.
Customer reviews
“If one has M365 which includes PowerBI pro, then integration with other M365 application like, excel in one drive, sharepoint etc becomes very easy..” – Deepak S., verified G2 user
Who Power BI is best for
- Microsoft-centric organizations: Already using Microsoft 365 and Azure.
- Budget-conscious teams: Seeking good value without compromising on core features.
Explore the detailed comparison of Qrvey vs Power BI or our article on Metabase alternatives to see how various embedded analytics tools stack up.
4. Looker: Best for Data Governance
As part of Google Cloud, Looker excels at providing a semantic layer that ensures consistent metrics across your organization. This makes it particularly valuable for companies that need to maintain a single source of truth for their data, but Looker Embedded Analytics may fall short for certain use cases.
Key features
- LookML semantic layer: Define metrics once and use them consistently across all reports.
- Google Cloud integration: Seamless connection with BigQuery and other Google services.
Looker’s Pricing
| Plan | Features | Price |
| Platform & User | Core features | Custom pricing |
Where Looker shines
- Data governance: Strong controls for maintaining consistent metrics.
- Collaboration: Excellent features for sharing and collaborating on analyses.
Where Looker falls short
- Learning curve: LookML requires more technical knowledge than some alternatives.
- Poor embedded experience: Despite marketing claims, Looker struggles with customer-facing analytics, creating disjointed experiences that don’t integrate seamlessly with your product’s UI.
- Cost: Premium pricing can be prohibitive for smaller organizations.
- Not suitable for SaaS: Cannot support multi-tenant environments, requires major workarounds.
Customer reviews
“One of the things I like best is how Looker allows teams to define a centralized “semantic layer” with LookML, which ensures that business logic is consistent across the entire organization.” – Shubham S., verified G2 user
Who Looker is best for
- Data-driven enterprises: Needing strong governance and consistent metrics.
- Google Cloud customers: Looking to leverage their existing Google Cloud investment.
See our top Looker Studio alternatives for better analytics options.
5. Sisense: Best for Complex Data Modeling
Sisense is great at handling complex data thanks to its ElastiCube technology. This makes it a strong choice for companies working with many different data sources.
Key features
- ElastiCube technology: High-performance data storage optimized for analytics.
- Self-service: Strong capabilities for internal enterprise BI deployment
Pricing
| Plan | Features | Price |
| Basic & Enterprise | Core features | Custom pricing for Sisense |
Where Sisense shines
- Data handling: Excellent for complex data from multiple sources.
- Deployment: Multiple methods include managed cloud, your cloud or on-prem.
Sisense’s broader scope may suit enterprises with diverse analytics needs, but it can be a shortcoming for SaaS teams needing speed, simplicity, and alignment. For SaaS companies who are looking for embedded analytics that are easy to implement, scale, and customize—Qrvey’s focused approach is a strategic advantage.
Customer reviews
“Sisense met the criteria we had set out for embedded analytics for our end users and some internal business analytics.” – verified Capterra user
Who Sisense is best for
- Organizations with complex data: Dealing with multiple sources and large volumes for internal BI users.
Looking for Sisense alternatives? Check out these top Sisense competitors.
6. Domo: Best for Mobile Analytics Experience
Domo sets itself apart with its mobile-first approach to business intelligence. If your team needs to access analytics on the go, Domo offers one of the most consistent experiences across devices.
Key features
- Mobile-first design: Optimized for phones and tablets without sacrificing functionality.
- Social collaboration: Integrated discussion and sharing features within the platform.
Domo’s Pricing
| Plan | Features | Price |
| Standard, Enterprise & Business | Core features | Custom pricing |
Where Domo shines
- Mobile experience: Best-in-class mobile apps for analytics on the go.
- Quick implementation: Faster time to value than many enterprise platforms.
Where Domo falls short
- Data governance: Less robust governance features than some competitors.
- Advanced analytics: Not as strong for complex statistical analysis.
- Not suitable for SaaS: Not built for multi-tenant environments
Customer reviews
“Gives great visibility to data collaboration across networks” – Jordan M., verified G2 user
Who Domo is best for
- Mobile workforce: Teams that need analytics access on multiple devices.
7. Spotfire: Best for Technical Teams
Spotfire combines advanced analytics with powerful visualization capabilities, making it ideal for technical teams that need to go beyond basic dashboards into more sophisticated analysis.
Key features
- Advanced analytics: Built-in predictive analytics and statistical functions.
- Scientific visualization: Specialized visualizations for research and scientific applications.
Spotfire’s Pricing
| Plan | Features | Price |
| All plans | Core features | Custom pricing |
Where Spotfire shines
- Technical depth: Powerful tools for statistical analysis and data science.
- Specialized industries: Strong features for life sciences, manufacturing, and energy sectors.
Flexibility: Highly customizable for specific analytical needs.
Where Spotfire falls short
- Implementation complexity: Requires more setup than some alternatives.
- Not suitable for SaaS: Limited embedded functionality, not for multi-tenant analytics environments
Customer reviews
“I have used Spotfire for reporting purposes in our MRTA – data & Reporting team. It comes loaded with data visualization capabilities for large datasets and helped in identifying the trends & anomalies.” – Ansh D., verified G2 user
Who Spotfire is best for
- Technical analysts: With statistical and data science background.
Specialized industries: Particularly life sciences, energy, and manufacturing.
8. Zoho Analytics: Best Budget-Friendly Option
If you’re looking for solid self-service analytics without breaking the bank, Zoho Analytics offers impressive capabilities at a fraction of the cost of enterprise solutions.
Key features
- Extensive integrations: Works well with other Zoho products and many third-party tools.
- Collaborative features: Share and collaborate on reports with team members.
Zoho Analytics’s Pricing
| Plan | Features | Price |
| Basic | Core features | $24/month |
| Standard | More storage and features | $45/month |
| Enterprise | Advanced features | $445/month |
Where Zoho shines
- Ease of use: Intuitive interface for business users.
- Ecosystem: Works well with other Zoho business tools.
Where Zoho falls short
- Advanced analytics: Not as strong for complex statistical analysis.
- Embedded BI limitations: Self-service embedded BI suited for internal use cases.
Customer reviews
“The great features to enjoy are the data analysis, the visualization, and the ease with the data connectors works.”- José F., verified Capterra user
Who Zoho is best for
- Zoho ecosystem users: Already using other Zoho products.
9. Grow: Best for No-Code Teams
Grow stands out for its no-code approach to business intelligence, making it accessible to teams without technical expertise.
Key features
No-code interface: Build dashboards without any technical knowledge.
Grows’s Pricing
| Plan | Features | Price |
| Standard | All features | Custom pricing |
Where Grow shines
- Simplicity: Very easy to learn and use.
- Quick time to value: Fast implementation and time to first dashboard.
Where Grow falls short
- Advanced analytics: Limited capabilities for complex analysis.
- Customization: Less flexible than more technical platforms.
- Not suitable for SaaS: No focus on multi-tenancy, only internal BI use cases.
Customer reviews
“I like its intuitive interface and easy-to-use features, which make it a breeze to connect to data sources”- Todd J., verified Capterra user
Who Grow is best for
Small businesses: Looking for quick insights without technical overhead.
Marketing and sales teams: Needing accessible metrics dashboards.
10. Qlik: Best for Associative Data Modeling
Qlik’s unique approach to data modeling sets it apart from other analytics platforms, allowing users to explore relationships between data that might not be obvious in traditional BI tools.
Key features
- Associative engine: Reveals relationships within data automatically.
- Unified hub: Single interface for all analytics needs.
Qklik’s Pricing
| Plan | Features | Price |
| Starter | 10 users | $200/month |
| Premium | 50 GB data | $2750/month |
Where Qlik shines
- Governance: Strong security and governance features.
- Enterprise readiness: Scales well for large organizations.
Where Qlik falls short
- Learning curve: Takes time to fully understand its approach.
- Cost: Premium pricing especially for small businesses.
Customer reviews
“The tool is good for developers. They allow is customize the code to a great extent, when compared to other visualization dashboards.”- Balaji S., verified Capterra user
Who Qlik is best for
- Enterprises: Needing strong governance and security.
11. IBM Cognos Analytics: Best for Enterprise Governance
For large organizations with strict governance requirements, IBM Cognos Analytics offers enterprise-grade business intelligence with strong security controls.
Key features
- Strong governance: Robust security and access controls.
- Flexible deployment: Cloud or on-premises options.
Pricing
| Plan | Features | Price |
| Standard | Essential features | $10.60/user/month |
| Premium | Enterprise features | $42.40/user/month |
Where IBM Cognos shines
- Scalability: Handles very large deployments well.
- Integration: Works well with other IBM products.
Where IBM Cognos falls short
User experience: Less intuitive than some newer platforms.
Customer reviews
“It provides a set of highly flexible and customizable features that help improve our analytics and positively impact our decision-making.”- Nicolas P., verified Capterra user
Who IBM Cognos is best for
Large enterprises: With strict governance requirements.
How to Choose a Self-Service Analytics Software
Ever stood in the cereal aisle overwhelmed by dozens of options, each promising to be the best? That’s what shopping for self-service analytics tools feels like for many teams. Let’s break down what really matters when making this choice.
Data integration capabilities
Your analytics tool needs to play nice with all your data sources. What good is a beautiful dashboard if it can’t access half your important information?
Look for tools that connect easily to your existing analytics databases, cloud storage, and business applications without requiring custom coding for each connection.
Take a quick tour of data setup with Qrvey in this clickable demo below:
The dirty secret in analytics is that data preparation typically consumes 80% of project time. That’s why Qrvey’s unified data pipeline is so valuable: it simplifies data consolidation into a single analytics data lake, removing the burden of maintaining multiple processing pipelines.
See how Qrvey can connect to all your data sources to enable self-service analytics→
Embedding and customization options
When adding analytics to your SaaS product, how it looks and feels matters tremendously. Your customers shouldn’t feel like they’re being bounced to a different application when they click on a report.
See how easy it is for your end-users to build their own charts in this clickable demo below:
Now, see how easy it is to customize charts with Qrvey in this clickable demo below:
Many traditional tools use clunky embedding methods that create a disjointed experience. Qrvey’s JavaScript-based embedding gives you complete control over the look and feel, ensuring analytics feel like they belong in your application.
Scalability and performance
We’ve heard horror stories about analytics implementations that worked fine with a few users but collapsed under load when deployed to thousands. That’s often because traditional analytics platforms weren’t built for modern multi-tenant SaaS applications.
As your user base grows, your data analytics solution needs to grow with it. Nothing frustrates users more than slow-loading dashboards or error messages when too many people use the system at once.

Qrvey’s Elasticsearch-powered data lake processes queries up to 50% faster than traditional data warehouses even with billions of rows of data.
Talk to a Qrvey expert about scaling your analytics →
Self-service capabilities
The whole point of self-service analytics is letting users answer their own questions without bothering your support team or waiting for custom reports. But there’s a balance to strike: tools that are too complex won’t get used, while those that are too simple won’t provide enough value.
Qrvey’s approach focuses on intuitive tools that non-technical users can pick up quickly:
- Dashboard builder with drag-and-drop functionality
- Visual data exploration without coding
- Ability to save and share reports with colleagues
- Customizable alerts for important metrics
- Export options for sharing insights outside the platform
Empower users to build faster on their terms: Learn more about Qrvey’s self-service analytics platform.
Build Faster, Smarter, and More Scalable Analytics with Qrvey
For SaaS companies, the choice becomes clear: purpose-built embedded analytics platforms like Qrvey deliver better results faster than either traditional BI tools or custom development. By focusing on the specific needs of multi-tenant applications, Qrvey eliminates the common stumbling blocks that derail analytics projects.
The real-world impact is significant. JobNimbus deployed Qrvey to over 6,000 customers and saw an immediate reduction in customer churn. Why? Because when users can easily access and analyze their data without leaving your application, they’re more likely to see value in your product and stick around.
Ready to improve how you deliver analytics to your customers? Schedule a personalized demo today and see how Qrvey can become your competitive advantage in 2026 and beyond.

Natan brings over 20 years of experience helping product teams deliver high-performing embedded analytics experiences to their customers. Prior to Qrvey, he led the Client Technical Services and Support organizations at Logi Analytics, where he guided companies through complex analytics integrations. Today, Natan partners closely with Qrvey customers to evolve their analytics roadmaps, identifying enhancements that unlock new value and drive revenue growth.
Popular Posts

Why is Multi-Tenant Analytics So Hard?
BLOG
Creating performant, secure, and scalable multi-tenant analytics requires overcoming steep engineering challenges that stretch the limits of...

How We Define Embedded Analytics
BLOG
Embedded analytics comes in many forms, but at Qrvey we focus exclusively on embedded analytics for SaaS applications. Discover the differences here...

White Labeling Your Analytics for Success
BLOG
When using third party analytics software you want it to blend in seamlessly to your application. Learn more on how and why this is important for user experience.