


⚡Key Takeaways
- Customer-facing analytics transform your SaaS product by giving clients direct access to their data through interactive dashboards and visualization tools right within your application
- Building analytics in-house typically takes 3-6 months and requires specialized expertise, while buying a solution like Qrvey can reduce implementation time by up to 10x
- The most successful customer-facing analytics implementations focus on simplicity, customization, and seamless integration with your existing product interface
If your customer-facing analytics is slow, clunky, or limited, customers won’t wait. They’ll just export data and leave.
What your customers really want is fast, intuitive dashboards baked into your product without needing your dev team on standby.
This article breaks down the better path: flexible, self-serve analytics that match your UX, support multi-tenancy, and actually scale. We’ll show you what to look for in a platform, how to avoid common pitfalls, and how top SaaS companies are doing this right now.
What is Customer-Facing Analytics?
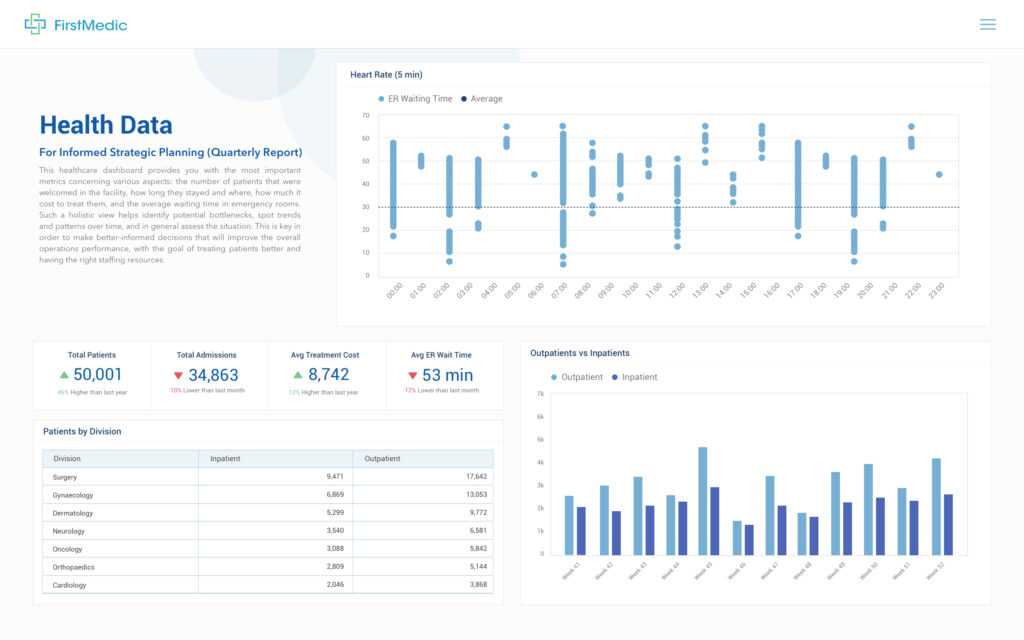
Customer-facing analytics refers to data visualization and reporting tools embedded directly into your SaaS application for your clients to use. Unlike traditional Business Intelligence (BI) tools designed for internal teams, these analytics are specifically built for your customers.
When done right, these tools become an invisible part of your product experience.
User-facing analytics empower your customers to explore their own data, create custom reports, and discover insights that matter to their specific needs without leaving your application or requiring technical expertise.
Core Features of Customer-Facing Analytics
The best customer-facing analytics solutions combine powerful functionality with exceptional user experience. Here are the essential features that make the difference:
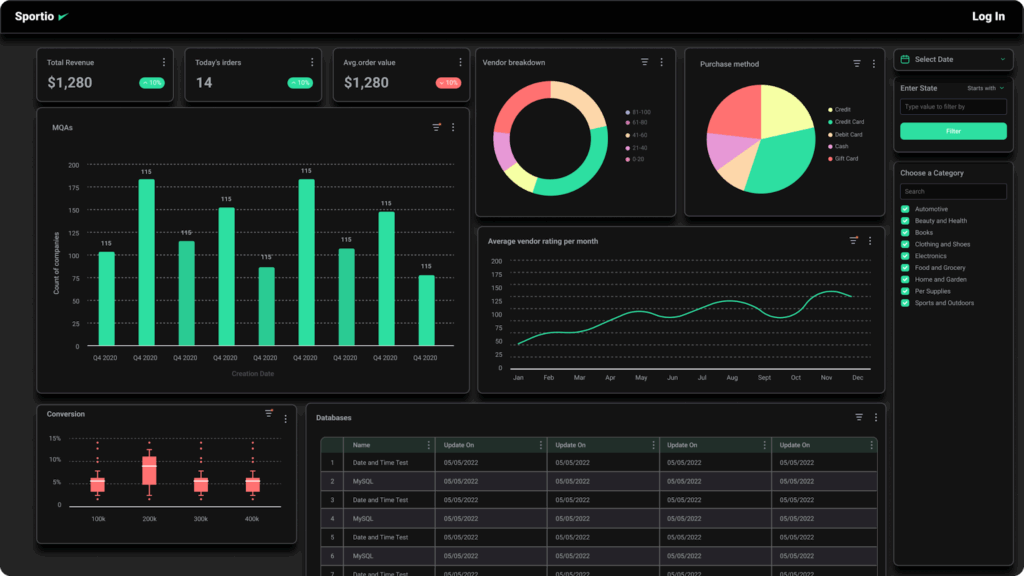
Interactive Dashboards
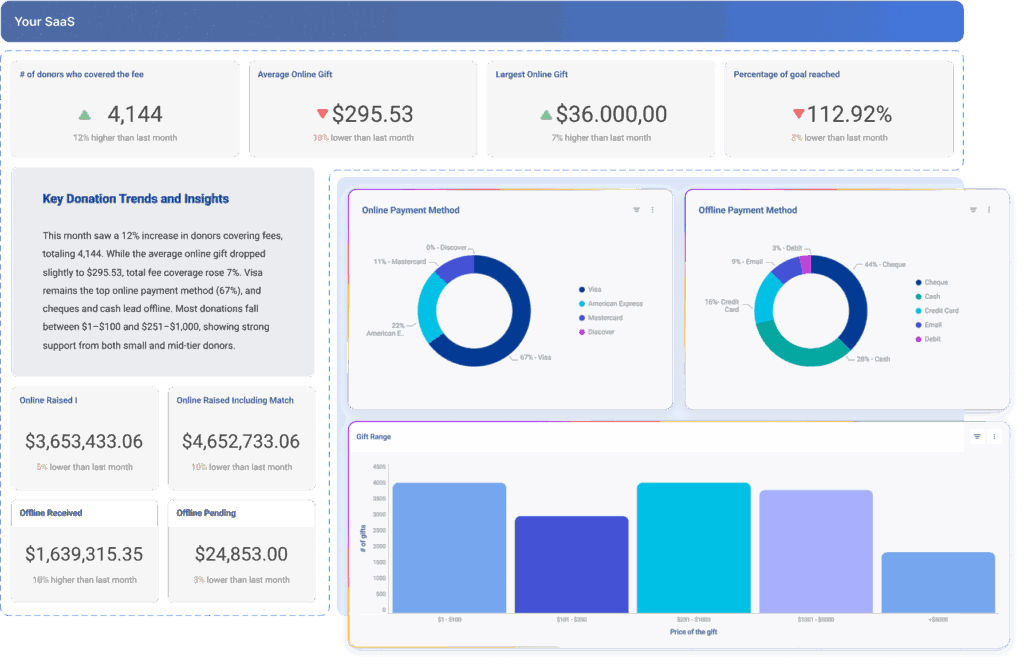
Interactive dashboards do more than just display static charts. They respond to user input, allowing filtering, drilling down, and exploring data relationships in real time.
With solutions like Qrvey, you can embed these interactive dashboards directly into your application, no clunky iframes required.
Your customers can click on data points to reveal underlying details, adjust date ranges to see trends over time, or filter information to focus on specific segments.
Self-Service Report Building
The days of customers submitting tickets for custom reports are over. Modern data analytics solutions provide intuitive drag-and-drop interfaces that let users create their own visualizations.
Your customers can select their metrics, choose visualization types, apply filters, and save custom views, all without writing a single line of code.
This self-service capability dramatically reduces the burden on your engineering resources while giving customers the flexibility they crave. It also opens the door for teams learning how to create interactive data visualizations without relying on engineering support.
White-Label Integration
Your analytics shouldn’t look like a third-party add-on. White labeling capabilities ensure your embedded analytics match your application’s look and feel perfectly.
This seamless integration includes:
- Matching your brand colors, fonts, and design elements
- Custom CSS styling options for complete visual control
- Consistent UI patterns that align with your application’s experience
The goal is for users to see these analytics as a natural extension of your product, not an obvious bolt-on solution.
Multi-Tenant Data Architecture
For SaaS providers, multi-tenant capabilities aren’t optional as your analytics platform needs to handle data segregation effortlessly.
Strong multi-tenant architecture ensures:
- Each client sees only their own data
- Security controls work at tenant, user, and data levels
- Performance remains high even with thousands of concurrent users
Challenges and Solutions in Implementing Customer-Facing Analytics
Even the best analytics tools come with implementation hurdles. Let’s explore the most common challenges and how to overcome them:
Data Volume and Performance Issues
When hundreds of customers run complex queries simultaneously, performance can suffer. Nothing frustrates users more than slow-loading dashboards or timing out reports.
Solution: Choose an analytics solution built for high concurrency and sub-second query results. Qrvey’s data lake architecture powered by Elasticsearch ensures your dashboards remain responsive even during peak usage.
“Adding Qrvey to our business was like turning on a light switch.” – Herman Haynes, CIO, Global K9 Protection Group
Security and Access Control Complexity
With multiple customers accessing analytics, maintaining proper data isolation and access controls becomes challenging.
Solution: Implement robust authentication methods that respect your existing security model.
Qrvey deploys directly to your cloud environment, inheriting your existing security policies while adding granular controls at the tenant, user, and data levels.
Learn the smarter way to deliver analytics inside your SaaS product
How Businesses Benefit from Customer-Facing Analytics
Implementing customer-facing analytics delivers concrete advantages that impact your bottom line. Here’s how:
Reduced Feature Requests and Development Burden
When customers can create their own reports and dashboards, the flood of feature requests for new analytics capabilities slows to a trickle.
Global K9, a canine protection services provider, initially built their K9 Analytics suite in-house. As they grew, their development team became overwhelmed with custom reporting requests.
After switching to Qrvey’s embedded solution, they saw a 60% reduction in analytics-related feature requests, freeing their developers to focus on core functionality.
Increased Customer Retention and Satisfaction
When customers regularly use your analytics to make informed decisions, they become more dependent on your platform. The data becomes an integral part of their workflow, making it harder to switch to competitors.
JobNimbus, a construction CRM provider, saw customer churn decrease immediately after deploying Qrvey’s interactive dashboards to their customers. Users who engage with your analytics tools are likely to renew at a higher rate.
New Revenue Opportunities
Customer-facing analytics can transform from a cost center into a profit center through tiered offerings.
You can structure your pricing to include:
- Basic analytics in standard plans
- Advanced visualization features in mid-tier plans
- Full self-service capabilities in premium plans
This tiered approach creates natural upsell opportunities while delivering more value to premium customers.
Top Metrics to Track in Customer-Facing Analytics
The most effective customer-facing analytics focus on metrics that drive business decisions. Here are the key categories to consider:
Usage and Adoption Metrics
Track how customers engage with your analytics to measure success and identify improvement opportunities.
Key metrics include:
- Dashboard views per user
- Time spent analyzing data
- Report creation frequency
- Most/least used visualization types
These engagement metrics help you understand which analytics features deliver the most value and where users might need additional training or support.
Top Metrics to Track
| Industry | Key Metrics |
| SaaS | User engagement, feature adoption |
| E-commerce | Conversion rates, cart abandonment |
| Healthcare | Patient outcomes, appointment no-shows |
Performance and Technical Metrics
Behind the scenes, monitor how well your analytics system performs to ensure a smooth user experience.
Important technical metrics include:
- Query response times
- Concurrent user loads
- Data refresh rates
- System uptime and availability
Monitoring these metrics helps prevent performance issues before they impact your customers.
Practical Use Cases Across Industries
Customer-facing analytics deliver value across virtually every industry. Here’s how different sectors leverage these tools:
Association Management
Professional associations rely on customer-facing analytics to help their members track engagement, event performance, and membership growth.
Impexium, an association management SaaS provider, faced challenges with their legacy analytics platform. Their customers needed self-service reporting capabilities and better ways to analyze member survey data.
Rather than spending months building these features in-house, they implemented Qrvey’s AWS-native solution. Impexium’s results were transformative.
Association managers gained access to customizable dashboards that let them track member engagement metrics, event registration trends, and revenue streams without IT assistance.
The serverless architecture ensured their platform could scale cost-efficiently during peak usage periods like annual conferences.
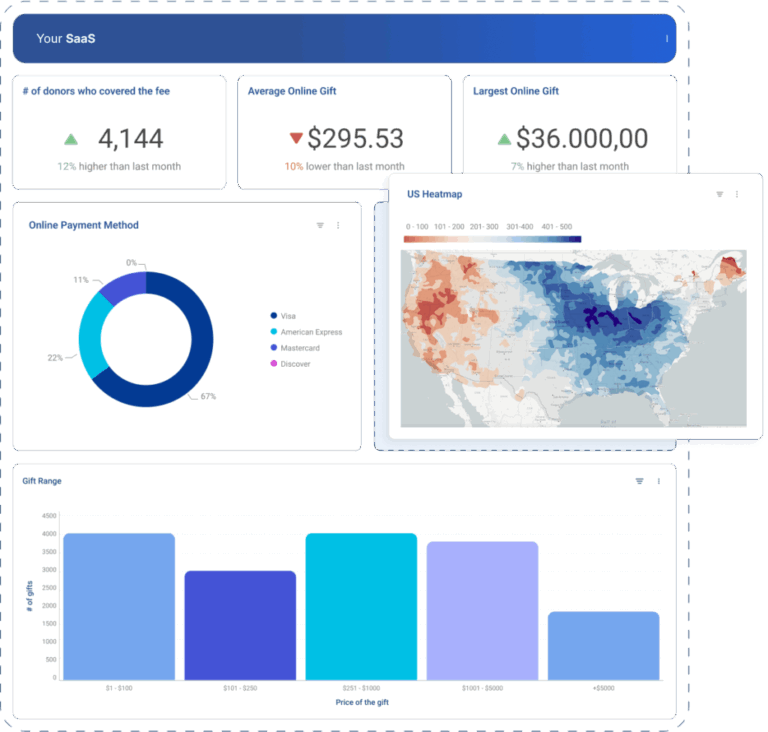
Financial Services
Banks and fintech companies use customer-facing analytics to help clients visualize spending patterns, investment performance, and budget adherence.
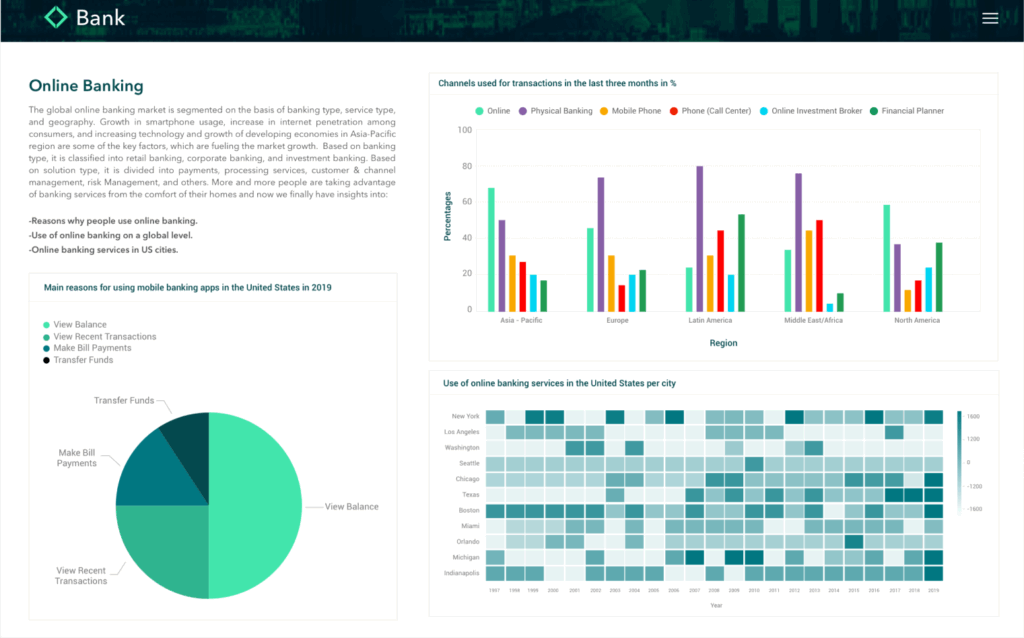
For example, a wealth management platform might embed portfolio analytics that show asset allocation, historical returns, and risk metrics.
Clients can adjust time periods, compare performance to benchmarks, and dive into specific investments, all without leaving the platform.
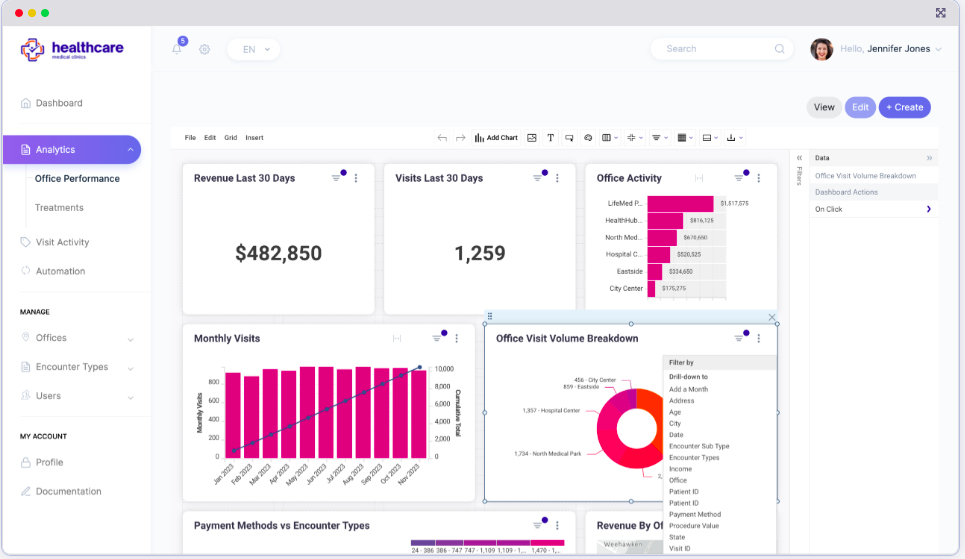
Healthcare and Telemedicine
Medical platforms use embedded analytics to help providers track patient outcomes, medication adherence, and practice metrics.
A telemedicine platform might include dashboards showing patient satisfaction scores, appointment completion rates, and clinical outcomes.
Providers can filter by date ranges, conditions, or demographic factors to identify trends and improvement opportunities.
Build vs Buy: Choosing Your Analytics Strategy
The biggest decision you’ll face is whether to build analytics in-house or purchase a dedicated solution. Let’s weigh your options:
Building In-House
Creating your own analytics from scratch gives you complete control over functionality and user experience.
Pros:
- Perfect alignment with your product design and workflows
- No recurring license costs
- Full control over feature development
- No dependency on third-party vendors
Cons:
- Typically requires 3-6 months of development time
- Needs specialized data engineering expertise
- Ongoing maintenance diverts resources from your core business
- Scaling for multi-tenant environments is complex
As Arman Eshraghi, CEO of Qrvey, notes: “If [available solutions] don’t give you the richness you want and require a lot of work without delivering the needed results, then building would be the better option.”
Purchasing a Solution
Working with a specialized provider like Qrvey can dramatically accelerate your time-to-market.
Pros:
- Launch analytics features in weeks instead of months
- Benefit from specialized expertise in data visualization
- Reduce burden on internal development teams
- Access continuous improvements without additional work
Cons:
- Recurring costs based on usage or users
- Some customization limitations compared to built-in-house
“The other deciding factor for buy versus build would be the industry maturity… in some cases, embedded analytic technologies have been around for decades, offering the maturity you want,” explains Eshraghi.
Choosing the Right Customer-Facing Analytics Platform
If you decide to purchase a solution, here’s what to evaluate:
- Embedding capabilities: Look for JavaScript-based widgets rather than iframe solutions for better integration
- White–label flexibility: Ensure the platform allows complete customization of the look and feel
- Data connection options: Verify the solution can connect to your existing data sources
- Cost structure: Evaluate whether pricing scales reasonably with your business growth
Remember that traditional BI tools like Tableau or Power BI weren’t designed for customer-facing use cases. Their licensing models and embedding approaches often create friction when used for external users.
Future Trends in Customer-Facing Analytics
The analytics world continues to evolve rapidly. Here are some key trends reshaping customer-facing analytics in 2026 and beyond:
AI-Powered Insights
AI-powered analytics are moving beyond basic anomaly detection to provide truly intelligent recommendations.

In practice, this looks like a B2B marketing platform that not only shows campaign performance metrics but also automatically identifies which customer segments responded best and suggests targeting adjustments for the next campaign.
Gamification Elements
Analytics are becoming more engaging through gamification techniques that motivate users to explore their data.
Data expert Scott Keith shared an example from a utility provider which sends simple but effective usage reports that compare customers’ consumption to their neighbors.
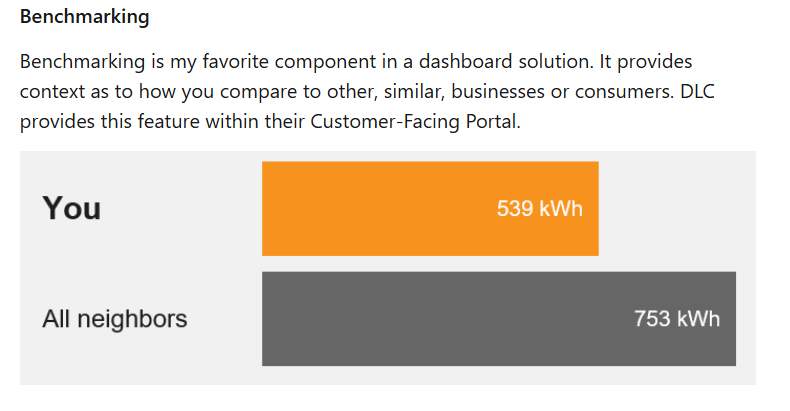
This social comparison creates a subtle competitive element that drives engagement far better than complex dashboards alone.
Future implementations might include achievement badges for report creation, points for data-driven decisions, or interactive challenges that guide users through discovering insights.
Conversational Analytics
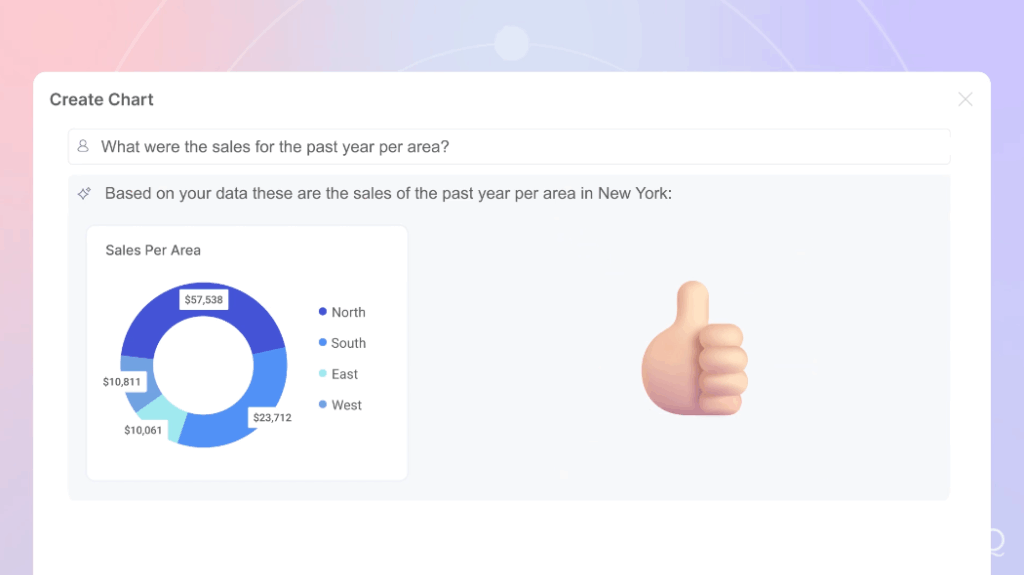
Natural language interfaces are making analytics accessible to non-technical users.
Users can simply type questions like “How did our conversion rate change last month?” or “Show me our best-performing products by region.” The system interprets these queries and displays the appropriate visualizations.
Next-generation platforms will incorporate voice insights, allowing users to have actual conversations with their data while driving or working on other tasks.
Common Mistakes to Avoid with Customer-Facing Analytics
Even with the best tools, implementation missteps can undermine your success. Here are the pitfalls to avoid:
Overcomplicating the User Interface
Many companies make the mistake of exposing too many features too soon, overwhelming users who just want simple insights.
Solution: Start with a focused set of high-impact dashboards that address your customers’ most pressing needs.
Neglecting Mobile Experiences
With more work happening on mobile devices, analytics that only function well on desktops create friction for users on the go.
Solution: Test the experience thoroughly on both tablets and phones to verify that interactions remain intuitive even on smaller screens.
Treating Analytics as a One-Time Project
Some companies launch analytics features, then fail to evolve them as user needs change.
Solution: Establish a regular feedback loop with users to understand how they’re using your analytics and what additional insights would help them.
Empower Your Business with Qrvey’s Embedded Analytics
You don’t need to spend months building analytics capabilities from scratch. Qrvey’s embedded analytics platform gives you all the tools to deliver powerful customer-facing analytics with minimal development effort.
Our solution deploys directly to your cloud environment, ensuring complete security while providing the flexibility to create fully branded experiences that match your application perfectly.
With Qrvey, you can be like JobNimbus that achieved 70% adoption among large enterprise users, within months of deployment.
Schedule a demo today and see how Qrvey delivers lightning-fast analytics your customers will love.

Natan brings over 20 years of experience helping product teams deliver high-performing embedded analytics experiences to their customers. Prior to Qrvey, he led the Client Technical Services and Support organizations at Logi Analytics, where he guided companies through complex analytics integrations. Today, Natan partners closely with Qrvey customers to evolve their analytics roadmaps, identifying enhancements that unlock new value and drive revenue growth.
Popular Posts

Why is Multi-Tenant Analytics So Hard?
BLOG
Creating performant, secure, and scalable multi-tenant analytics requires overcoming steep engineering challenges that stretch the limits of...

How We Define Embedded Analytics
BLOG
Embedded analytics comes in many forms, but at Qrvey we focus exclusively on embedded analytics for SaaS applications. Discover the differences here...

White Labeling Your Analytics for Success
BLOG
When using third party analytics software you want it to blend in seamlessly to your application. Learn more on how and why this is important for user experience.